
How Atlas Analytics Made A ~50% Return Year-To-Date
Atlas Analytics’ Weekly Subscriber Update

Clients and colleagues often ask me:
“Ok, you can predict GDP, but how will that help me or my firm?”
I then show them this chart directly from my Schwab account and jaws drop. They drop because they then see what we at Atlas Analytics have always seen: If you can accurately forecast economic activity, you can predict where the financial markets are heading.
Q2 GDP: Proof in the Pudding
This isn’t just theory. In Q2, we called GDP at +4.3% three months before the release. Consensus was far lower: the Atlanta Fed stood at +2.4%, the New York Fed at +1.7%, and most Wall Street shops clustered around 2–3%. When the BEA’s final print came in at +3.8%, our forecast was the closest in the industry.
That accuracy mattered. By linking GDP momentum to earnings, valuations, and sector performance, we guided clients toward sectors set to outperform. The market rewarded those who trusted the signal.
Atlas in Action: ~50% Return Over the Last Year
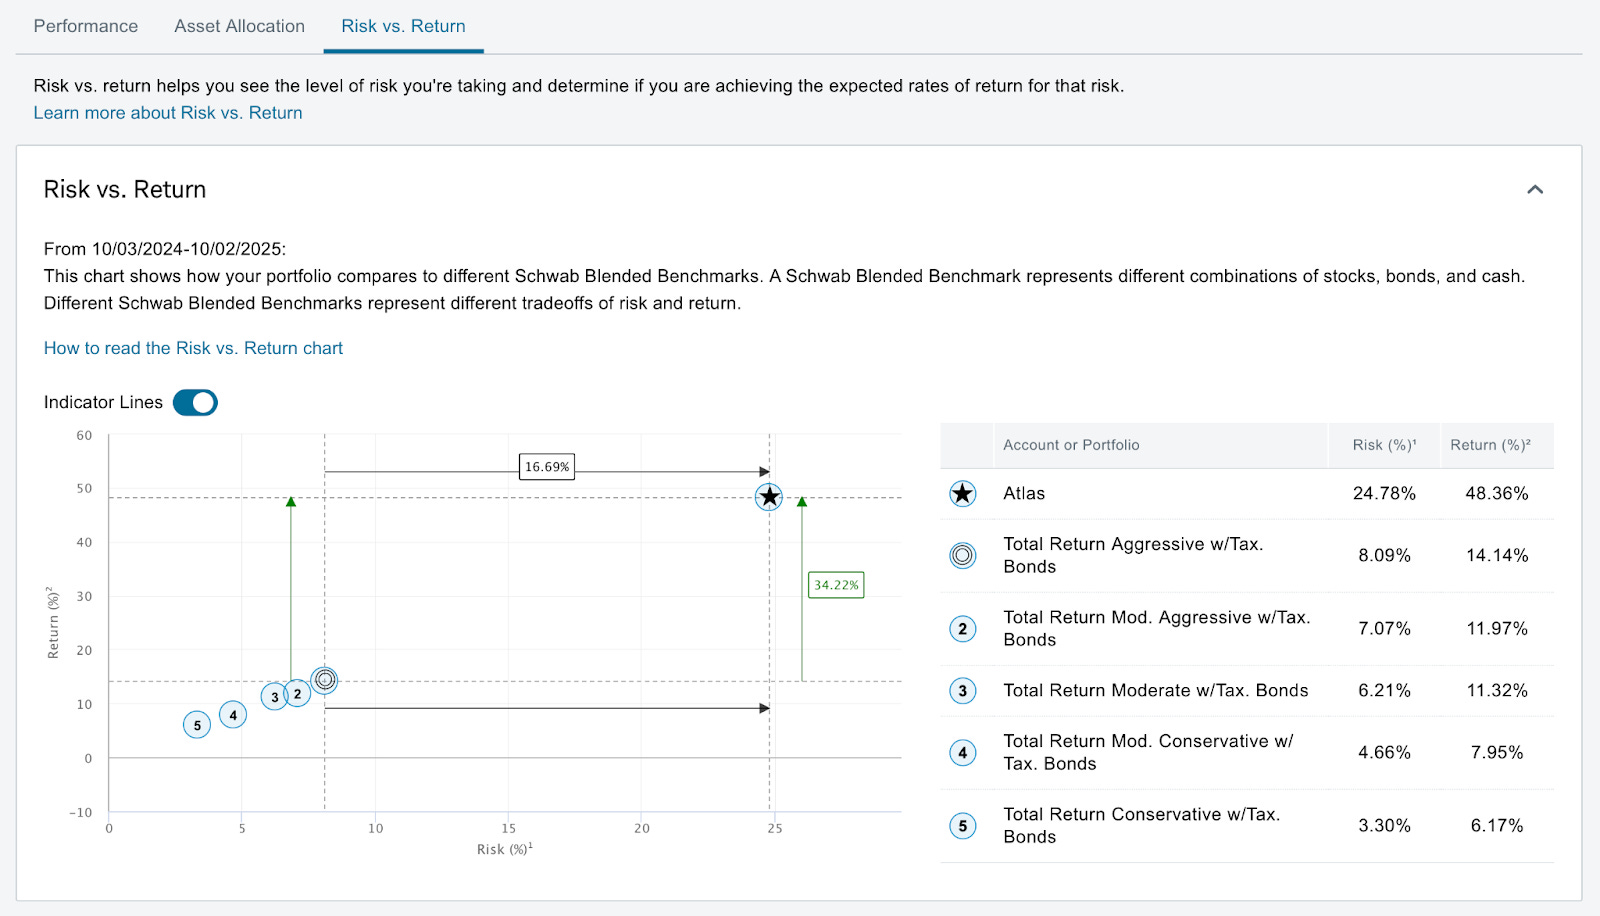
The ultimate test of any forecasting system is performance in real portfolios. Over the past twelve months, our strategy, powered by Atlas signals, generated a +48.36% return (Oct 2024 – Oct 2025).
Compare that to the benchmarks:
NASDAQ: +28.3%
S&P 500: +19.2%
Aggressive 80/20 Portfolio: +14.1%
In other words, Atlas more than doubled the S&P and comfortably outpaced the NASDAQ during a volatile year.
And we did it without taking reckless risks. Our measured portfolio volatility was ~24.8%. That’s higher than a passive benchmark, but the payoff was extraordinary.
Sharpe Ratio: 1.9
Using a conservative risk-free rate of ~3% (1-year Treasury), the Sharpe ratio works out to about 1.9.
What does that mean? In plain English:
A Sharpe above 1.0 is considered “good.”
A Sharpe above 2.0 is “excellent.”
Hedge funds, on average, hover around 0.7–1.0.
Atlas is running at nearly double the efficiency of the hedge fund industry, delivering returns that are not just high, but high per unit of risk taken.
This is why our clients (hedge funds, asset managers, and family offices) are paying close attention.

The Philosophy: Markets as a P/E Ratio
At Atlas, our guiding philosophy (encapsulated here in our article “The Tale of Two Prices”) is straightforward: the relationship between the financial markets and the economy works like a price-to-earnings ratio.
The “P” is the price of financial markets—whether it’s the S&P 500, the Nasdaq, or a sector ETF like XLK in the chart above.
The “E” is the earnings power of the economy, measured not at the company level but at the aggregate level: GDP.
When markets are trading far above what GDP fundamentals would imply, investors are effectively paying a high “multiple” for growth. When markets trade below GDP momentum, they’re at a discount.
This framework gives us a powerful lens: GDP provides the “anchor,” and market prices tell us whether investors are too exuberant or too pessimistic. By tracking both, we can gauge when to lean in, when to hedge, and when to step aside.
Regression Results: The Economy–Market Link
Over the past several years, we’ve run hundreds of regressions linking GDP growth to market performance. A few findings stand out:
GDP vs. Equities: Broad equity indices (like the S&P 500) track GDP momentum with a lag. Stronger GDP means stronger forward returns, particularly in cyclical sectors.
GDP vs. Rates: Rising GDP prints consistently pressure the yield curve higher, as bond markets anticipate tighter monetary policy. We wrote about this a few months ago when we predicted that the U.S. Federal Funds Rate would move lower (spoiler alert: it did last month).
GDP vs. FX: U.S. GDP momentum relative to global peers predicts the direction of the dollar, with higher relative growth translating into dollar strength. We wrote about this as well (twice) and the USD has in fact stabilized since its fall.
These results aren’t just academic: they form the foundation of our financial market targets.
Technical Appendix: Regression Under the Hood
(Casual readers can skip this section as this part is for the trained economist or portfolio manager who wants to kick the tires.)
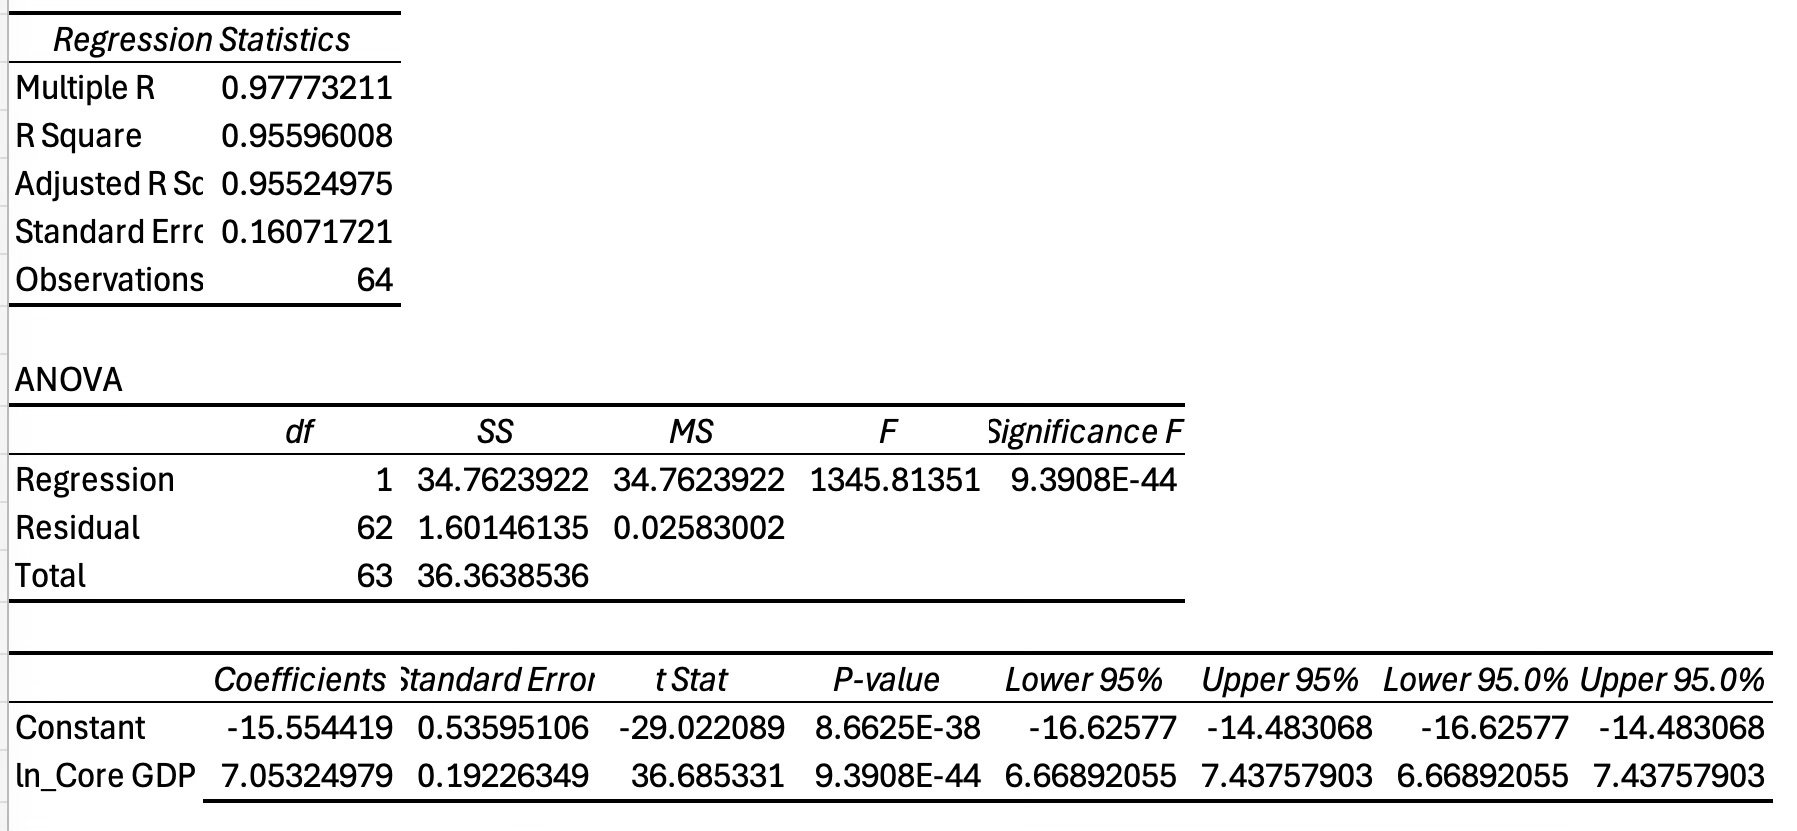
We take both GDP and market prices (here XLK as an example) in natural log form and adjust for stationarity before estimating the regression. The result is striking:
The t-stat on our variable of interest (ln GDP) is 36—an extraordinarily high level of statistical significance.
The adjusted R² comes in at 95%, meaning our model explains 95% of the variation in XLK’s price since 2009.
In other words, the link between economic growth and market performance is not just intuitive—it’s quantifiable and robust.
Don’t believe us? Try replicating it yourself, and write me if you do.
From GDP to Market Targets
Here’s our process in plain English:
Forecast the economy: We use satellite imagery, alternative data, and proprietary econometrics to generate real-time GDP estimates.
Translate into financial variables: Our regression models map GDP forecasts into expected returns across equities, bonds, and FX.
Set targets: These expected returns are then turned into explicit market targets, where we think the S&P, 10-year yield, or USD/EUR should trade.
For example, when our Q2 GDP signal came in much stronger than consensus, our models pointed to equity upside and a stronger dollar. Both calls played out.
How Clients Use Atlas Signals
Our clients (hedge funds, asset managers, and family offices) are integrating these forecasts in different ways:
Macro hedge funds use them to size directional bets in equities and currencies.
Equity long/short managers use them to overweight or underweight sectors most exposed to GDP momentum.
Family offices use them to tilt portfolios defensively or aggressively, depending on where we see growth heading.
In each case, the common thread is simple: our GDP signal gives them a three-month head start on the rest of the market.
Our Track Record
This isn’t just “one good call” last quarter when we again beat the Fed and nearly all private forecasters. This is truth, extracted from satellites and delivered weekly to our clients.
As the chart shows, quarter after quarter, Atlas has consistently landed closer to the BEA’s final GDP print than consensus forecasters.
In fact, after last quarter’s success, our Mean Absolute Error (MAE) dropped to just 0.5 percentage points. For context, that’s better than the BEA’s own revision history, where the average revision from Advance → Final is about 0.7 pp (source here).
Accuracy isn’t luck. It’s a system. And our system works.
Join Us
If you’re an investor, allocator, or policymaker who wants to see the economy (and the markets) before the rest of the world does, Atlas Analytics is built for you.
Subscribe to our Substack for weekly insights
Contact us for enterprise access to our full forecasting suite
Follow us on YouTube for quarterly breakdowns and sector calls
And stay tuned: our Q3 GDP call is coming mid-October in our usual format—published here on Substack and on our YouTube channel.
Because when you can see tomorrow’s economy today, you can trade it today.
Somehow both simple and complicated, this is really impressive to 2x hedge fund performance. Satellite imagery is notoriously difficult to work with, this kind of transforming into usable metrics might actually be game changing -- especially when energy demands will become an increasingly large part of GDP growth in the AI economy