
How Atlas Generated 21% Returns and 23 Points of Alpha in 2026
From shorting long-duration bonds to arbitraging ETFs, Atlas signals identified several macro opportunities while the NASDAQ and S&P are negative year-to-date

The average hedge fund has returned ~5.3% per year over the last decade1.
A model portfolio informed by Atlas signals has returned nearly four times that amount in the first ten weeks of the year.
While the sample period is short, the early results illustrate the potential of the Atlas approach.
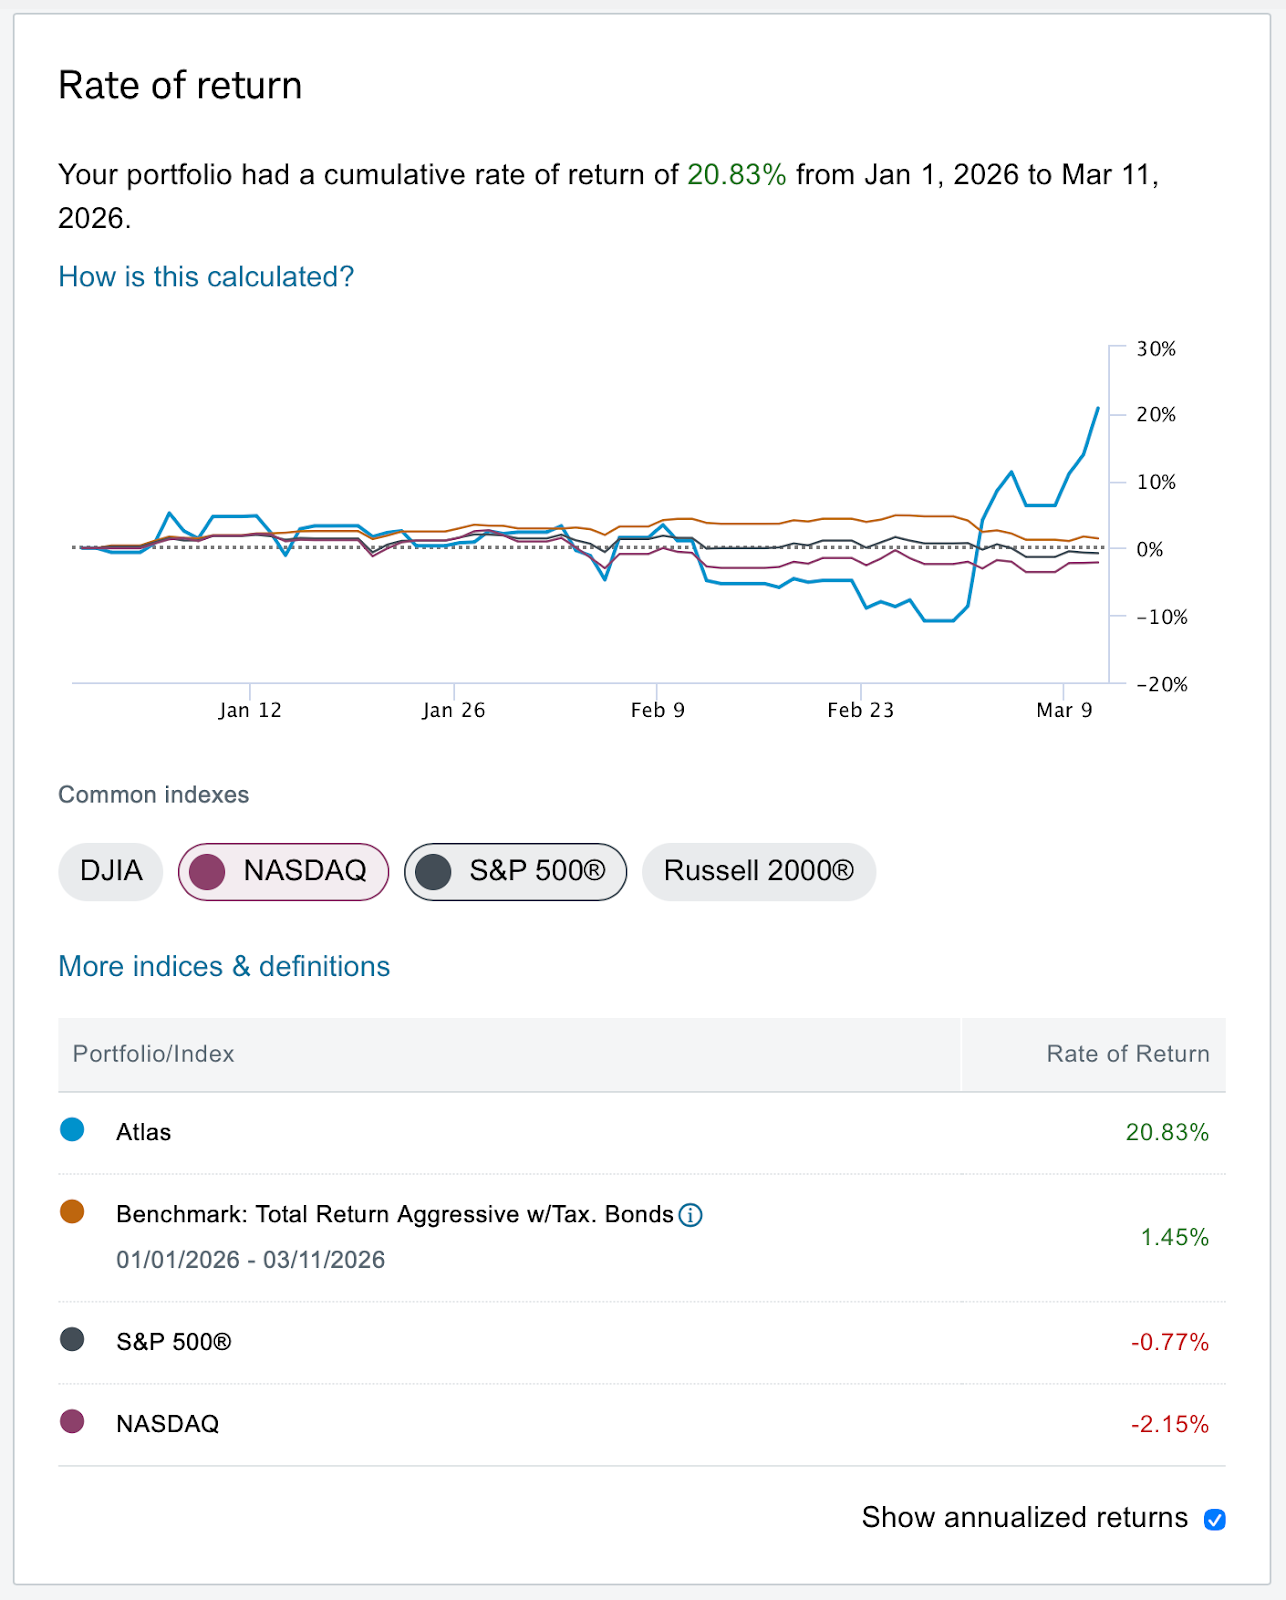
Atlas signals generated approximately 21% year-to-date in a model portfolio through a combination of systematic macro trades (such as shorting long-duration bonds and going long the USD) and arbitraging the deviations between fundamental value and market price for a bevy of ETFs.
In short: better economic measurement creates an informational edge in financial markets.
The performance reflects a repeatable framework that links forward-looking economic data with macro-exposed financial instruments.
Atlas converts satellite imagery into forward-looking economic indicators that inform both client research and, in this case, a demonstration portfolio used to illustrate how those signals can be applied in financial markets.
Atlas’ Portfolio Performance
Our recent performance is not a statistical gimmick. It is the recognition of a new way of viewing economic value through satellites.
As I’ve written about at length on our Substack, Atlas utilizes geospatial imagery and our proprietary, patent-pending algorithms (ROY and a forthcoming invention we’ll disclose shortly) to ingest pictures of Earth, transform this into economic data, and then use this to predict future GDP performance ahead of government releases.
With this forward-looking view on economic activity, we create price targets for a subset of macro-exposed ETFs and a coherent view of future likely macroeconomic conditions.
These signals can then be applied to financial markets through options or positions in the underlying securities.
The early results have been encouraging.
Atlas Portfolio Performance vs S&P 500
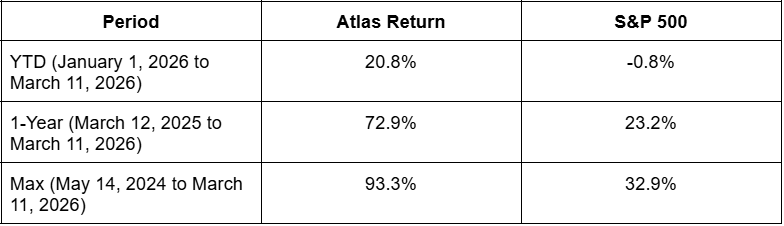
Since May 2024, the Atlas portfolio has produced cumulative returns of approximately 93%.
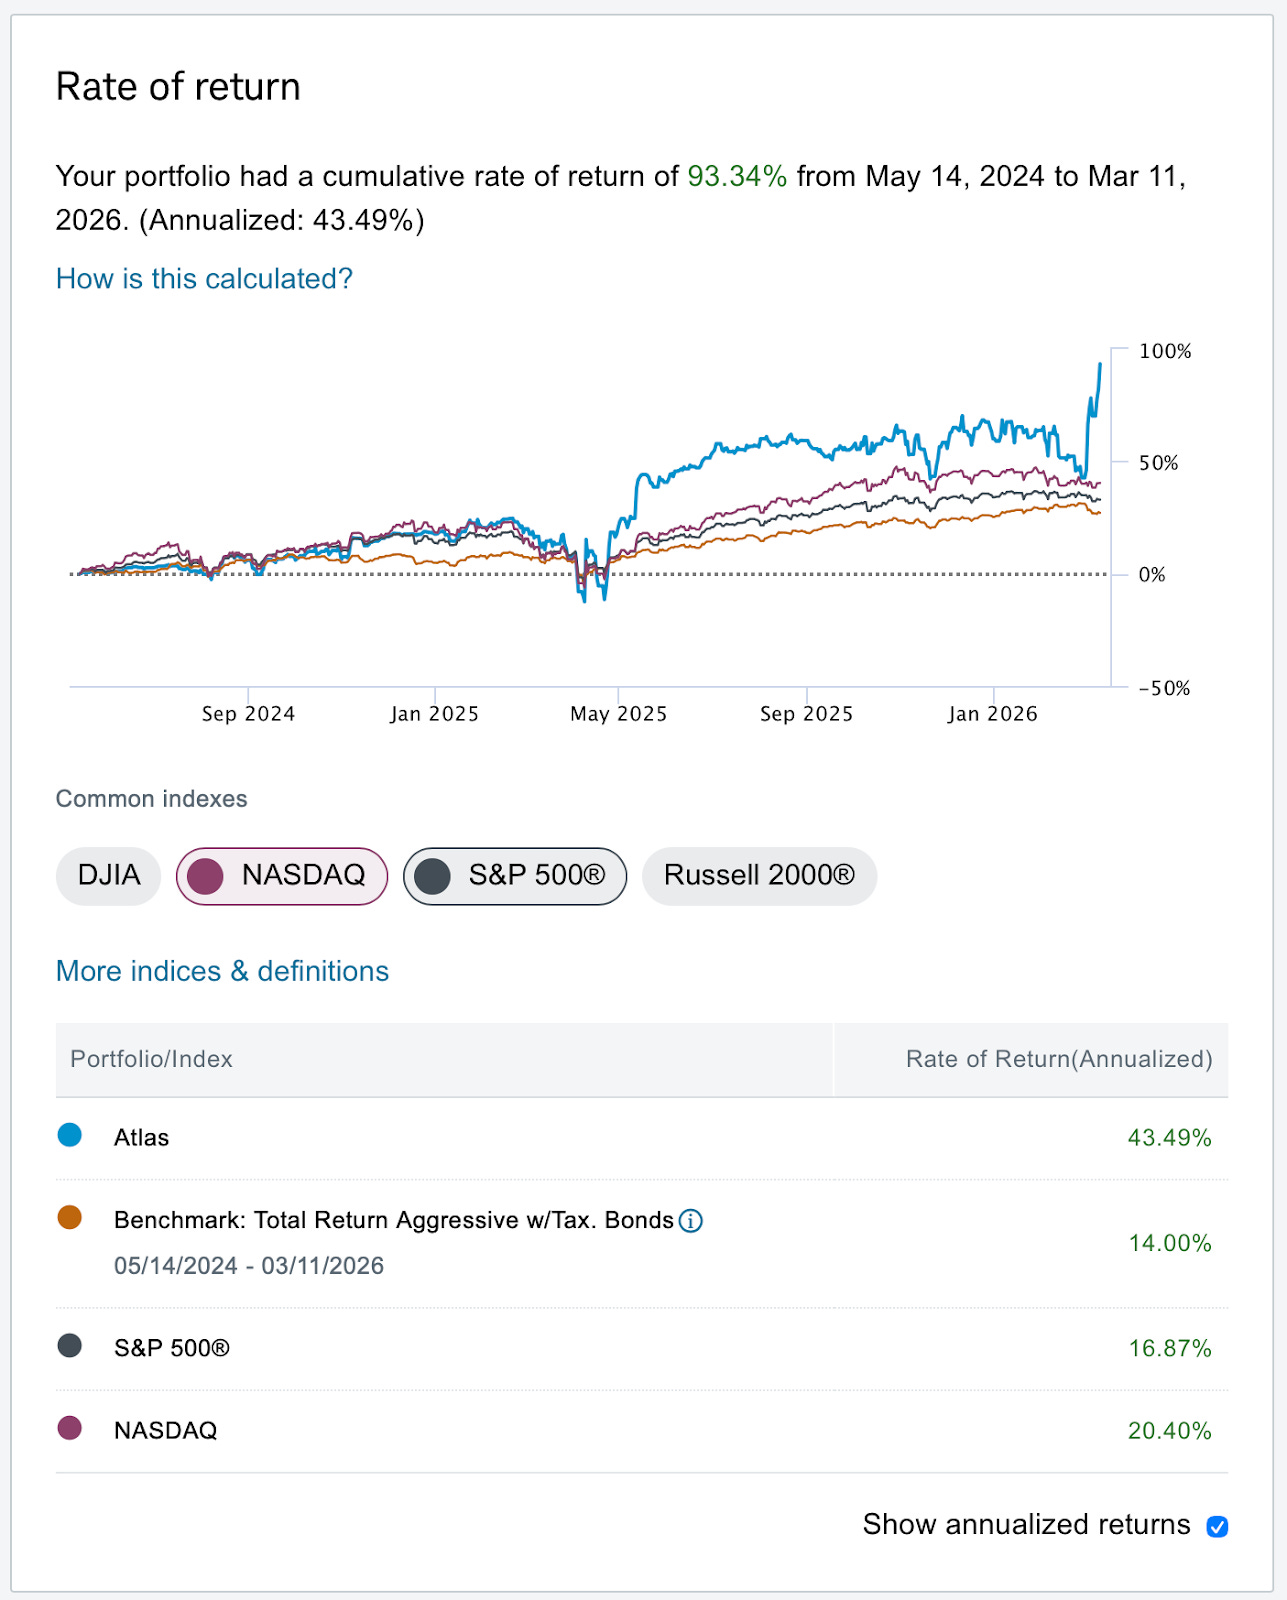
When compared to the S&P 500, the Atlas Portfolio has 22 percentage points of alpha in the first 10 weeks of 2026, 50 points of alpha over the last year, and 61 points over the last nearly two years.
On a transaction basis, nearly two-thirds have been winners.
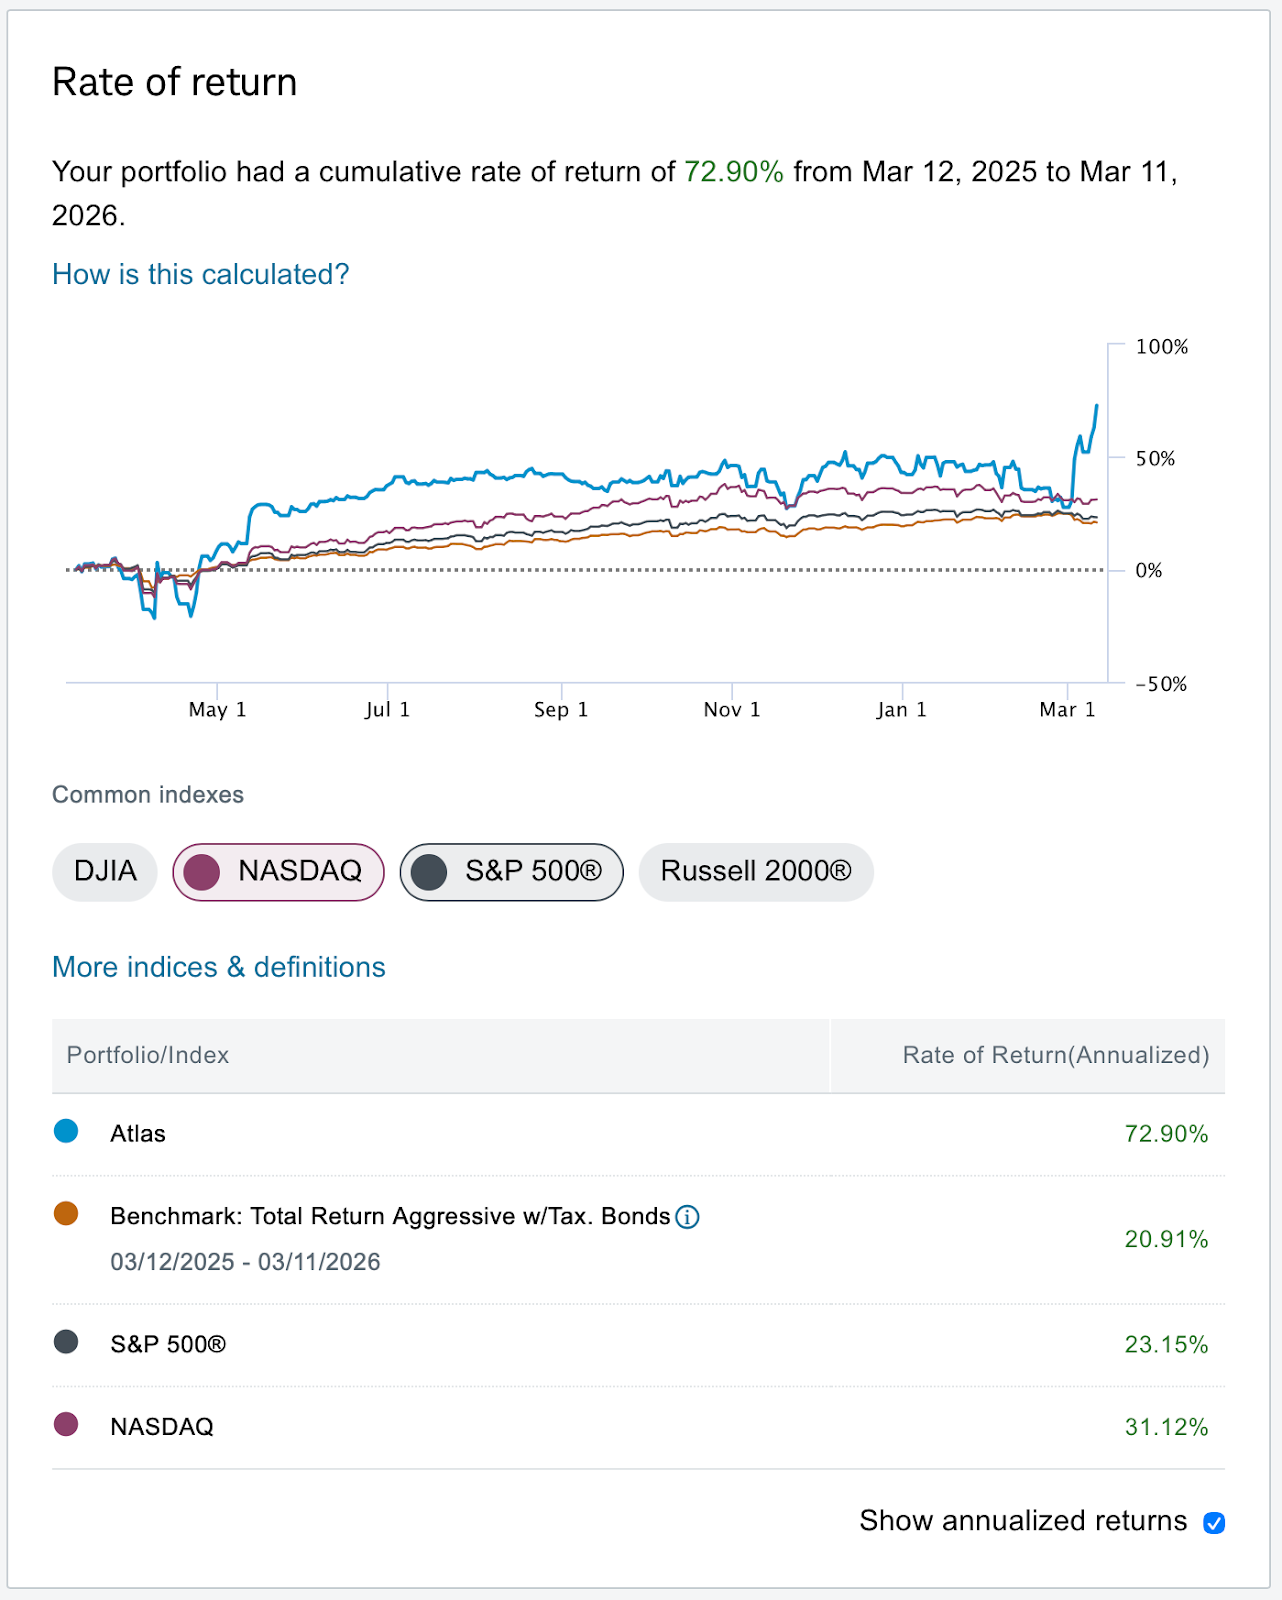
Atlas Macro Strategy (One Year: March 2025 - 2026)
Return: +72.9% annualized
Volatility: 41.4%
Sharpe Ratio: 1.69
Alpha vs S&P: ~21%
A one-year Sharpe Ratio of 1.69, where 1.5 is generally considered strong and 2.0 is considered elite, compares favorably with many hedge fund strategies.
The early results suggest the framework is working.
The Atlas Trading Strategy
As I tell my financial clients, if you can predict GDP with both accuracy and timeliness, you can often anticipate the direction and magnitude of movements in financial markets.
I do this in two ways:
Arbitraging the Deviation Between Fundamental Value and Market Price for ETFs:
The market oscillates day-to-day for largely short-term sentiment and macro headlines that traders assign value to, often arbitrarily. I’ve long discussed the difference between fundamental value and market price for equities (for instance, see this article The Tale of Two Prices from the spring 2025).
Traders believe that a war in the Middle East, the assignment of tariffs during Liberation Day and other associated short-term events are selling opportunities. Although they might be, often the moves are much more exaggerated than they should be. Our Atlas signal cuts through this noise based upon 50 years of economic data to answer the basic question that financial analysts should be asking: Has the fundamental basis of economic activity as visible from the satellites changed due to the event?
If the answer is yes, then I update my priors and rebase our financial targets based on the data.
If the answer is no, then in fact this is a buying opportunity, as the move to the downside is overdone.
This is how you make money in the financial markets using statistics, rather than discretionary reaction.
Systematic Macro Trading Based on a Forward-Look at the Plausible Economic Environment
If you can predict GDP ahead of the market consensus, you have a vantage point to analyze the likely macro regime of the unfolding epoch. For instance, earlier this year I wrote that, despite calls from the consensus to the contrary, that interest rates from the Federal Reserve would be likely higher (not lower).
How did I come to this conclusion?
As I elucidated here in our article “Powell Paused. The Data May Force the Next Fed Move Higher”, two observations informed this view.
First, GDP was likely stronger than the market was pricing in. (As a side note, I was wrong for Q4 largely due to the Government Shutdown and Net Exports, as I’ve openly admitted. The BEA also revised Q4 growth down to 0.7% from 1.4% on March 13. That revision reinforces how volatile and backward-looking official GDP releases can be and why forward-looking indicators are useful for interpreting the evolving macro environment.)
Second, inflation would likely be more sticky than previously thought. Both CPI and PCE inflation have remained above the Federal Reserve’s 2% target.
As I wrote in Powell Paused: the combination of strong economic growth and sticky inflation is not an environment in which the Fed cuts. In fact, it is the opposite.
Recent minutes from the Federal Reserve’s FOMC show that several members are considering similar risks. And the bond market is waking up to the same reality, with this Bloomberg article suggesting bond yields are rising in anticipation of a higher benchmark interest rate.
Atlas data allowed me to identify and trade this opportunity early.
Two Illustrative Trades
How did I trade this in practice?
Arbitraging ETF Fundamental Value vs Sentiment Deviations: Short the XLI
As I stated above, if you can predict GDP, you can predict ETF prices. One example I’ve traded recently is shorting the XLI.
The XLI is the State Street sector spider for industrials. Despite pallid returns across the market this year (the NASDAQ is down 2% and the S&P is down 0.8%), the XLI has jumped nearly 12% at its peak on March 2.
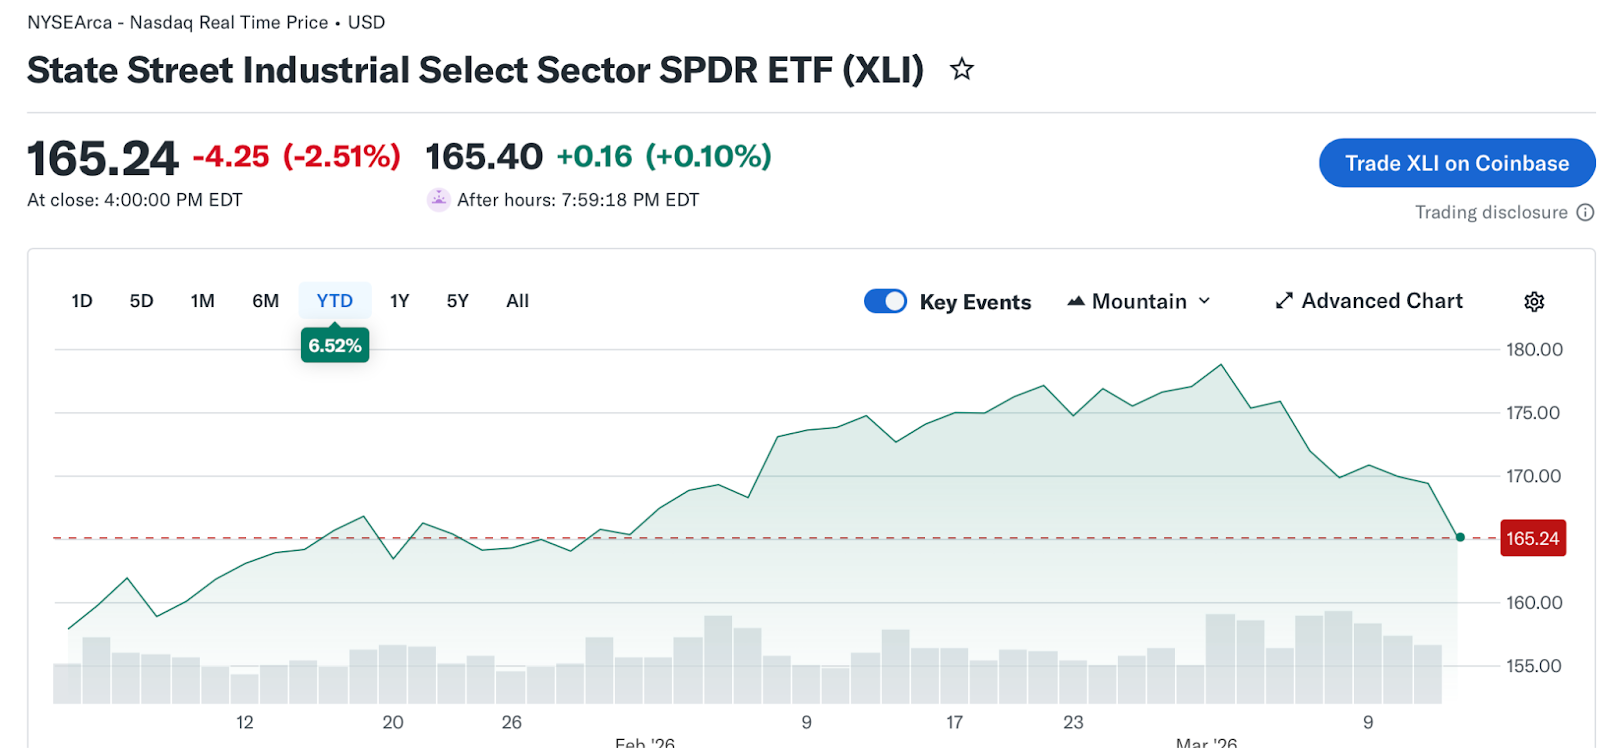
This jump was spurred on bullish sentiment and some economic reality, but it was overbought and our Atlas data cut through that.
On February 22, I shorted it by buying puts (4 contracts, 171 strike price, March 27 expiration). The stock then summarily declined. I closed the contract on March 3 grossing approximately $1500.
As bullish sentiment has over-run its economic basis, I believed the XLI was over-valued and the position benefited when the broader market declined.
Systematic Macro: Short the TLT
I wrote three months ago that the consensus was wrong, that economic growth was too strong and inflation too high for persistent rate cuts, and therefore long-duration bonds were at risk of a violent repricing.
I traded this, buying long-dated puts on the TLT (25 contracts, 88 strike price, July 17 expiration).
Bonds rallied in the first two months of the year and I admit, I was nervous. But I stuck to my thesis. This last week, the TLT plummeted, dropping from 90.82 to 86.97 as of close on Thursday.
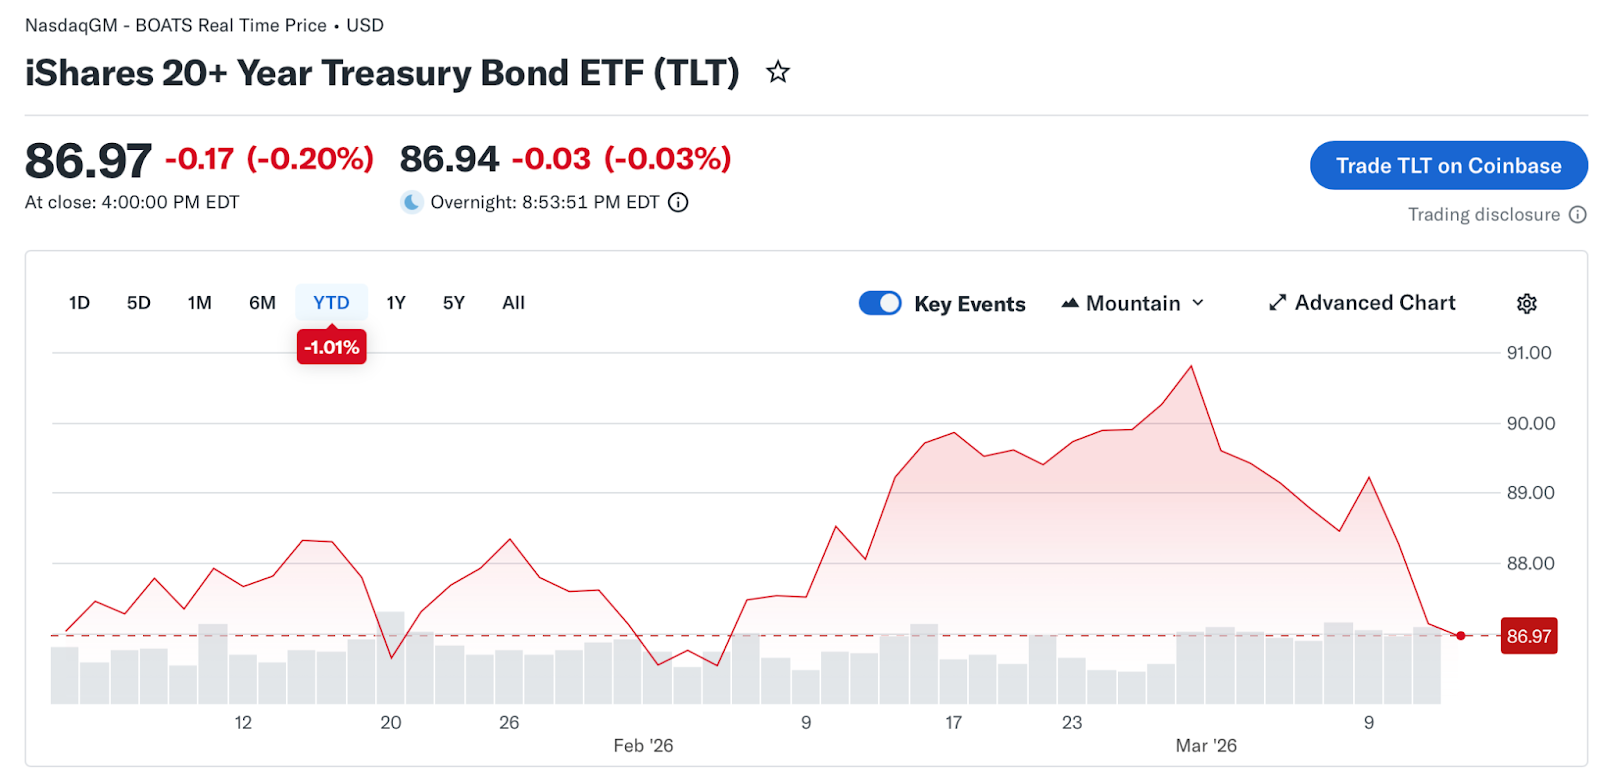
I closed 10 contracts on Thursday morning (recovering my initial investment); I will let the rest run using the house’s money to earn an asymmetric potential payoff.
The position benefited as Treasury yields rose following stronger economic data and hawkish Fed commentary.
What This Means for You
The Atlas framework is built on a simple premise: if you can measure economic activity earlier and more accurately than the market, you can trade ahead of consensus.
Satellite imagery provides a new dataset through which to observe the economy in near real-time. By converting those observations into macro forecasts and tradable signals, Atlas aims to create a systematic edge in financial markets.
The portfolio performance shown here simply illustrate how those signals can translate into financial market opportunities.
The results so far are encouraging. And as the dataset expands and the algorithms continue to evolve, the opportunity set may grow even larger.