


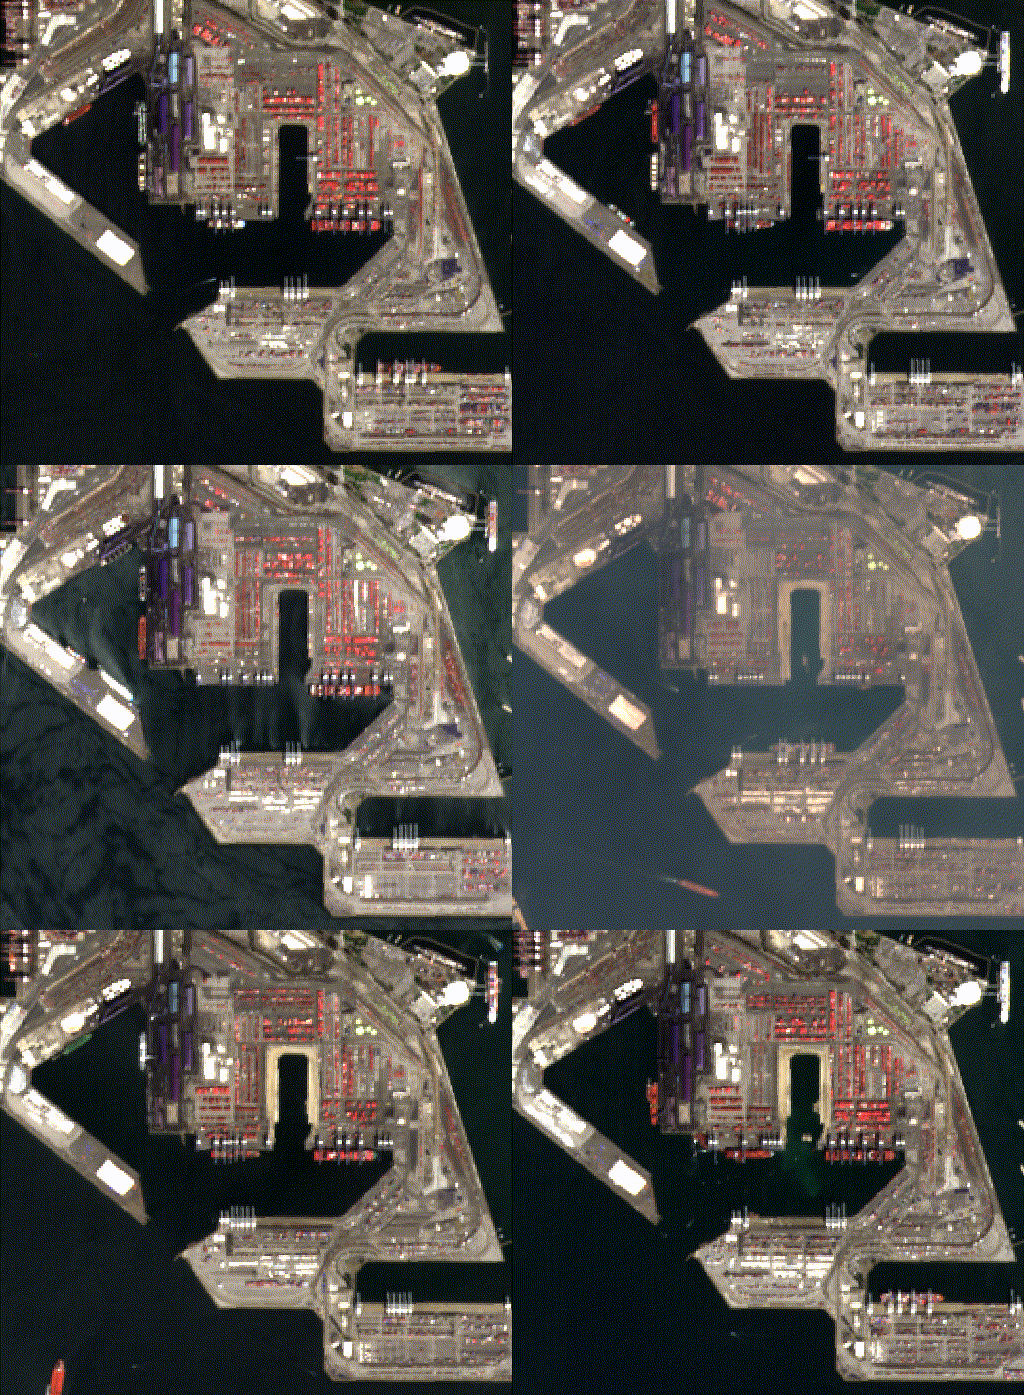
Each year, trillions of dollars in global trade move through ports before that activity appears in official economic data.
Containers are unloaded, sorted, stored, and shipped onward weeks before economists, investors, and policymakers have a complete read on what those movements mean for the economy and the market.
Ports are more than container distribution hubs. They are physical gateways into the global economy, supporting containerized trade, energy transport, industrial supply chains, tourism, and offshore operations. Making maritime activity one of the clearest places to observe economic demand as it is happening, rather than after it has already been reported.
At Atlas Analytics, this raised a simple question: if satellites can help measure the physical economy in real time, can they also measure the maritime economy through port activity?
That is why we built JACK.
Meet JACK
Our proprietary algorithm, ROY, gave Atlas a way to measure Core GDP by observing the domestic physical economy from space. JACK extends that approach to the maritime and trade economy working in tandem with ROY.
Net Exports are a critical component of GDP, but they remain difficult to measure in real time. Official trade data often arrives after the underlying activity has already happened, leaving you with a delayed view of one of the economy’s most important moving pieces.
JACK, short for Joint Algorithm for Containerized Knowledge, was built to close that gap.
Using AI/ML, satellite imagery and computer vision, JACK monitors container activity across major U.S. ports in real-time and translates those observations into earlier estimates of imports, exports, trade value, and the Net Exports contribution to GDP. For decades, economists have attempted to estimate international trade using surveys, customs reports, shipping manifests, and delayed government releases.
But trade is fundamentally a physical process:
Ships depart and arrive
Containers move
Ports expand and contract
These movements are observable phenomena.
How JACK Works
To understand the value of port-level measurement, consider the combined exports moving through Los Angeles and Long Beach, two of the most important container gateways in the U.S.
The chart above compares reported export activity with Atlas’s JACK-derived estimates. The goal is not simply to count containers. It is to determine whether visible port activity can be translated into an economic signal: how much trade is moving, in what direction, and with what implied value.
That relationship is the foundation of JACK.
The shipping container, an engineering accomplishment in and of itself, has allowed for widespread, efficient, standardized transport of goods over the last 50 years.
Shipping activity is commonly measured in 20ft Equivalent Units, or TEUs, the standardized unit used to describe container volume. Because containerized trade is standardized across ports, changes in container density and movement can become useful signals for estimating trade activity.
This leaves two important pieces of information for JACK:
Physical signatures through the number of containers loading and unloading on the docks;
Real dollar value of goods every week, quarter, and year.
Every port is different, whether its vehicles through Baltimore, electronics through LA and Long Beach, or appliances and airplane components through Charleston. JACK builds a statistical profile of dollars moving through ports, first by counting the number of TEUs coming and going and second by translating those containers full of goods into dollars. Each port tells us something about the nation as a whole. And when we look at the largest contributors, we can model the underlying value of exports and imports.
Because shipping containers are internationally standardized, JACK’s approach can extend beyond U.S. ports over time. As more ports come online, Atlas can build a broader real-time picture of trade activity across countries and regions.
And from there, JACK is designed to estimate the Net Exports contribution to GDP in near real time.
What Port-Level Signals Unlock
The U.S. is one of the world’s largest trading nations, with nearly $6 billion in annual exports and imports of goods and services. A meaningful share of that activity moves through ocean ports, where containers, vessels, and terminal operations create a real-time record of economic demand before that demand appears in official data.
Most maritime data tells users where ships are. JACK is designed to answer a different question: what is happening to the cargo, what impact does that cargo have in supply chains, and what does that activity imply for trade flows, trade value, and GDP?
That distinction matters. A ship’s location can tell you that goods are moving. Container activity can help reveal whether imports are accelerating, exports are weakening, inventory is building, or trade patterns are shifting across ports and regions.
For macro investors, that can provide an earlier read on growth, inflation pressure, and trade-driven changes in GDP.
For logistics and supply-chain teams, it can improve visibility into cargo movement and port-level congestion.
For enterprises, asset owners, and diligence teams, it can offer a faster view into physical economic activity in markets where reported data is delayed, fragmented, or incomplete.
This is where JACK and ROY become especially powerful together. ROY measures the domestic physical economy. JACK measures the trade economy moving through ports.
Together, they give Atlas a fuller real-time view of GDP, built from observable changes in the physical world.
From Signal to Actionable Insights
In our recent Q1 2026 GDP release, when Atlas forecasted 2.0% GDP growth exactly in line with the first official estimate, we introduced JACK, our second algorithm.
Today, JACK analyzes satellite imagery from three of the largest U.S. ports by volume: Los Angeles, Long Beach, and Newark. Built on Atlas’s patent-pending computer vision and machine learning system, JACK detects and counts TEU activity moving through major port infrastructure.
If your organization needs a faster way to understand trade flows, port activity, or the Net Exports contribution to GDP, we would welcome the opportunity to connect.
This article was written with valuable assistance from Morgan Reppert, Chief of Staff for Atlas Analytics.