
The Origins of Atlas Analytics
Atlas Analytics’ Weekly Subscriber Update

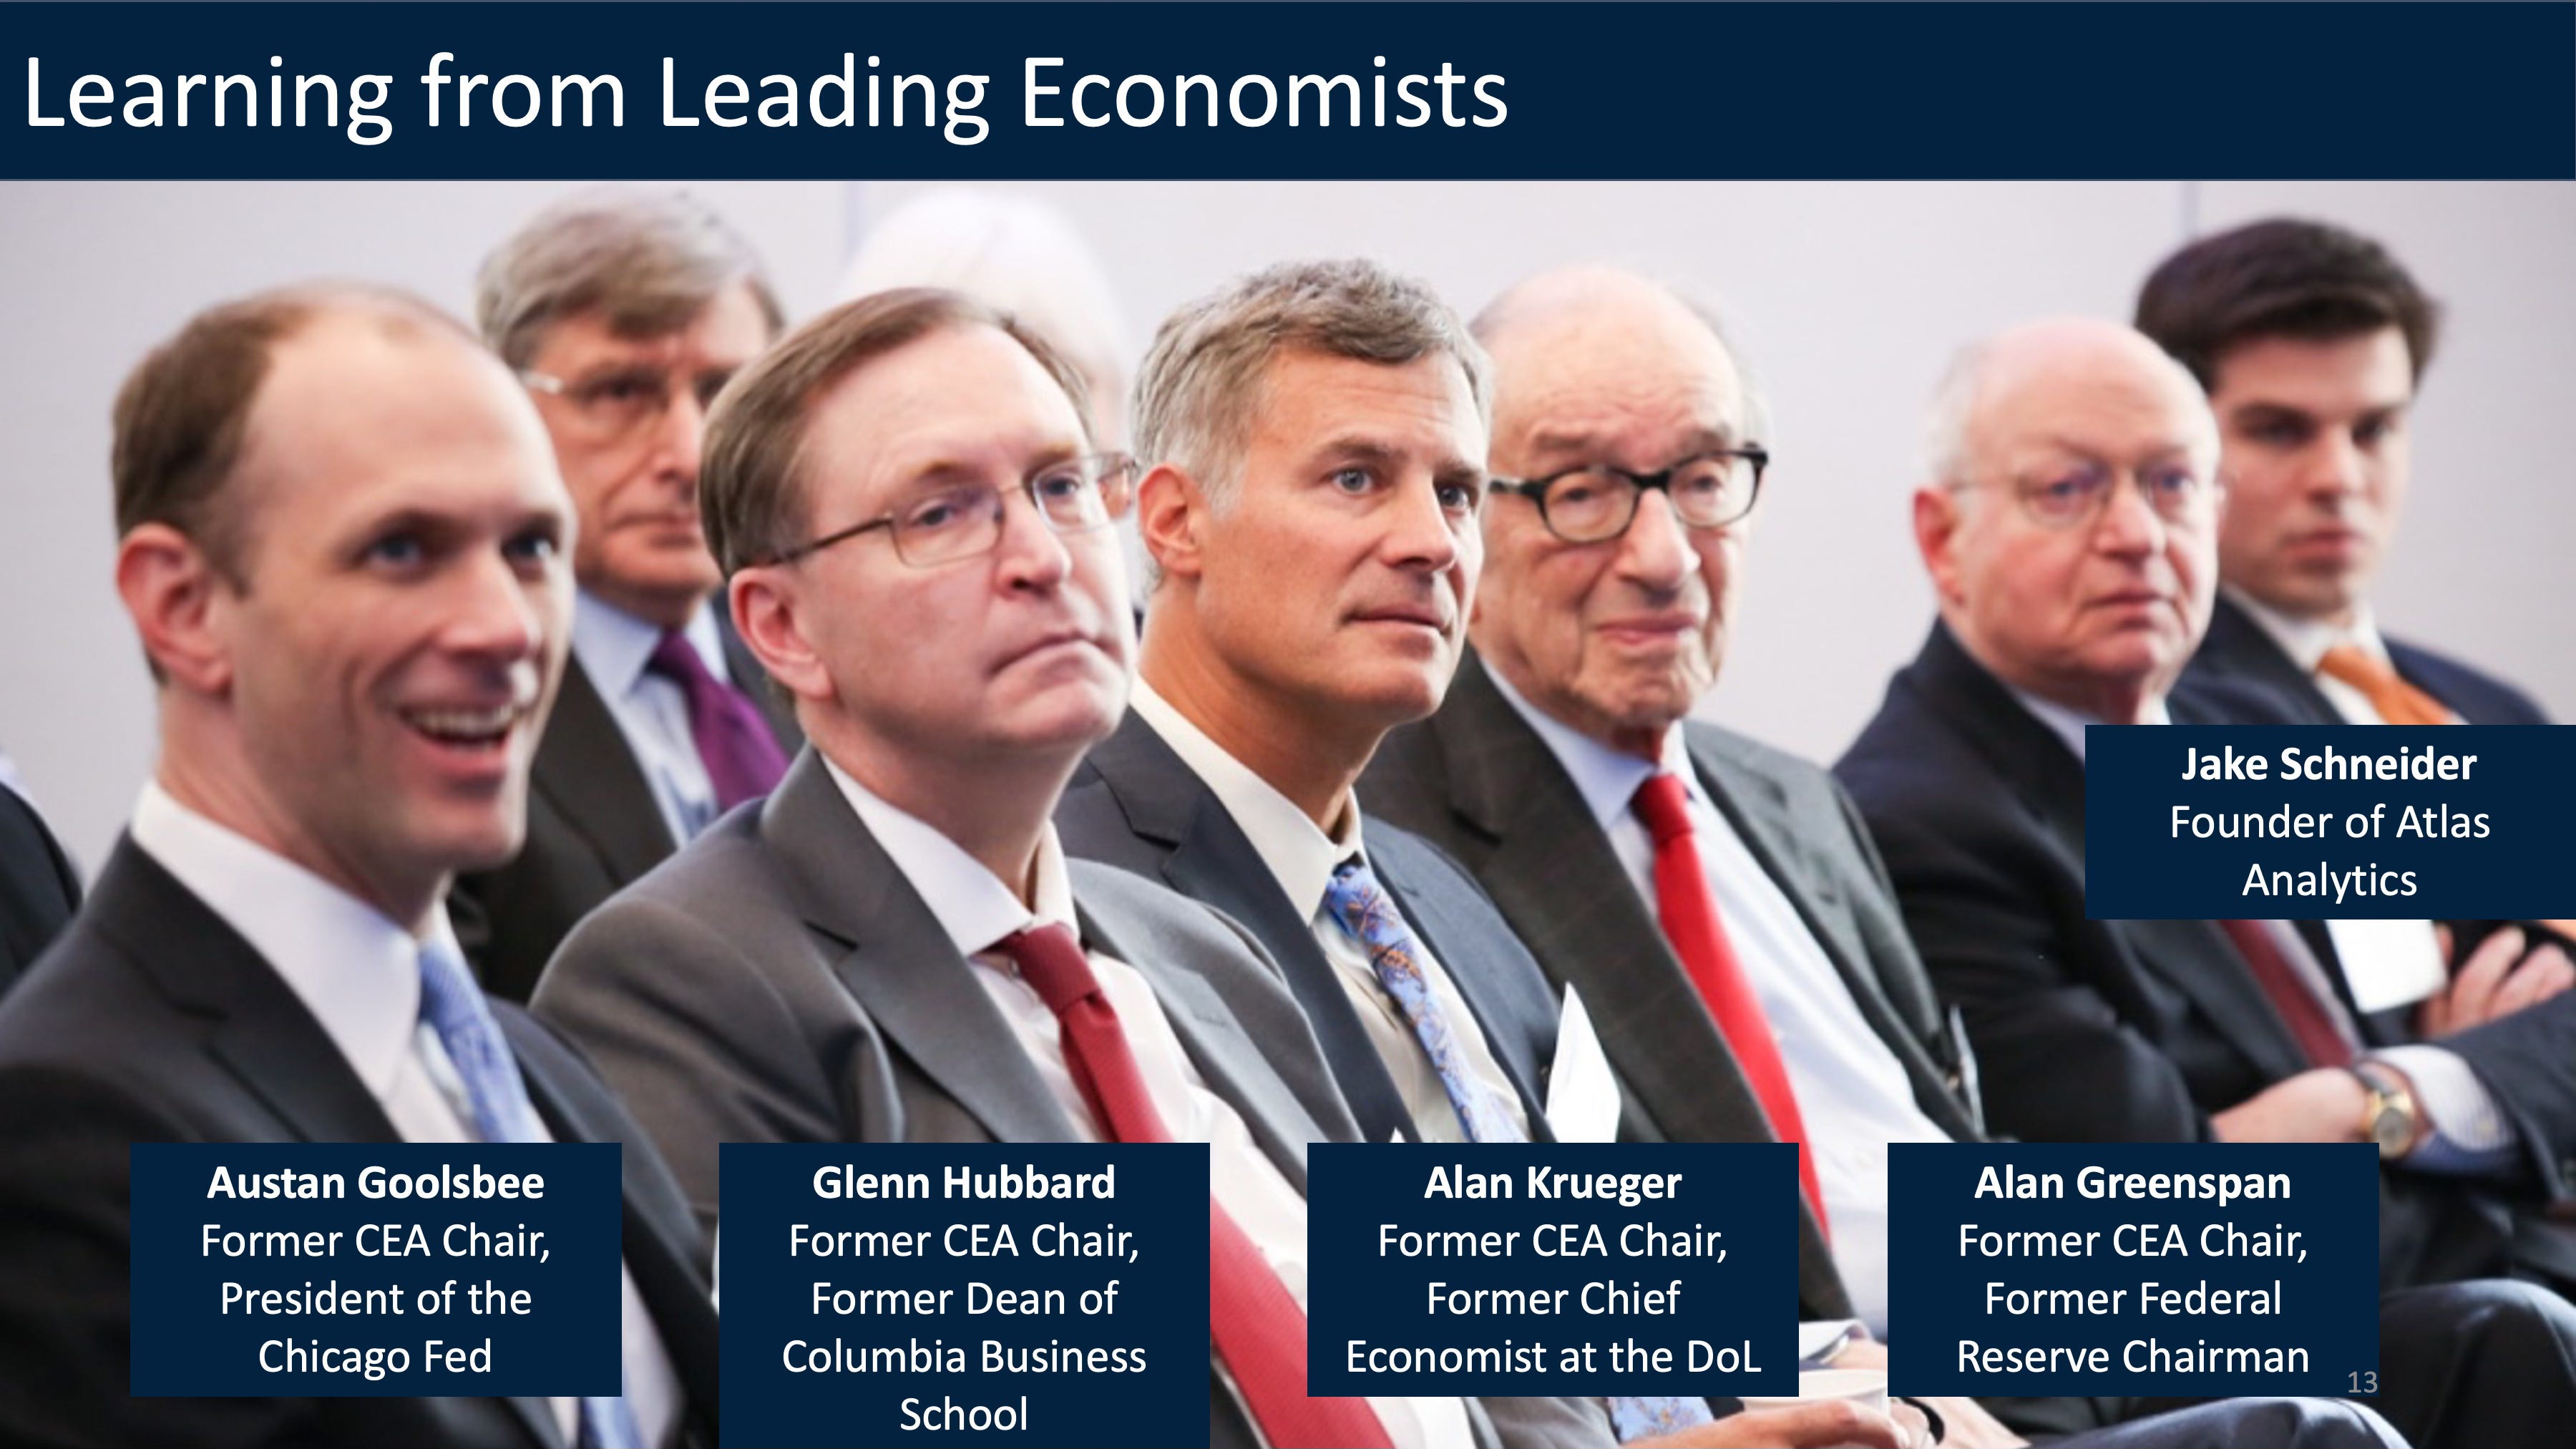
Leading Economists at a Brookings Institution event, February 2016
I’ve spent the last decade building toward one goal: using real-world signals, not lagging indicators, to forecast economic activity. From working under Alan Greenspan to building Atlas Analytics’ core algorithm, I’ve fused traditional macroeconomic training with cutting-edge AI and geospatial tools to develop a new way to see the economy in real time.
“Who are you and why are you telling me about GDP forecasts?”
It’s a fair question, and one I hear often from clients when we first meet.
I’m early enough in my career that skepticism is natural. But I also think that’s part of what makes this journey worth sharing.
In this article, I want to offer a quick sketch of how Atlas Analytics came to be, spanning my time working directly for Alan Greenspan and leading to my company’s core model, ROY, which is named after my grandfather.
A Chance Encounter
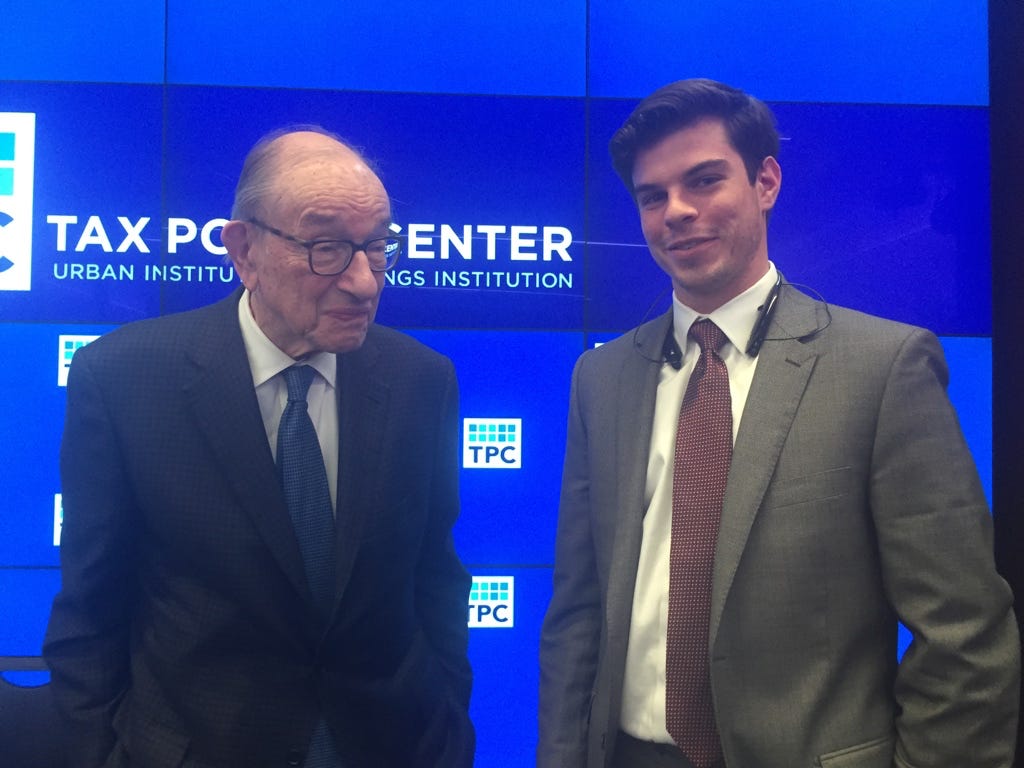
Greenspan and Schneider at a Brookings Institution talk, April 2015
“My name’s Jake, I’m an intern at the U.S. Treasury Department, and I’m a huge Greenspan fan. I actually read his autobiography The Age of Turbulence, I have it with me here in Washington, and I’d love to have it sent over to your office for him to sign. Would you mind if I followed up?”
So I said to former Federal Reserve Chairman Alan Greenspan’s Chief of Staff at his keynote speech at The Brookings Institution in April 2015.
Little did I know what was in store for me.
When I arrived (expecting to merely drop off the book), the doors to his office opened, and Greenspan himself emerged to welcome me into his office.
Next I knew, I was interviewing for my first job!
Lessons from Greenspan

Celebrating Schneider's birthday in Greenspan’s office, August 2015
Working for Alan Greenspan was like stepping into the cockpit of the global economy. Every day was a masterclass in how financial markets and economic fundamentals intertwine. What struck me most wasn’t just his encyclopedic knowledge but rather his instinct to look beyond the headline numbers.
He always asked: What signals tell us where the economy is actually going?
To answer that question, he would call companies directly about current conditions and build a real-time monitor of industrial production. When I worked for him, we updated that monitor weekly, interpolating the data into his broader capacity model.
These lessons stuck with me. Economic models are only as good as the data you feed them. And if that data is lagging, your forecasts will always be late.
The Spark of Atlas Analytics
After stints at Bain and The World Bank, and then graduate work at Harvard and Oxford, I saw the same problem repeated: economists and investors relying on delayed government reports, often revised months later. Markets were moving faster than the models designed to track them.
The spark for Atlas Analytics came from a simple question: What if we could measure the economy directly in real time? Satellites offered a vantage point no spreadsheet ever could. Ports, factories, farmland, highways: the real-world signals of economic activity were all visible from space.

Building ROY
That idea became ROY (Remote Orbital Yield), Atlas Analytics’ core GDP forecasting algorithm. ROY fuses traditional macro training with AI and geospatial tools to measure activity as it happens. We can see cargo ships moving through ports, crops being harvested, and industrial output rising or falling, long before official statistics catch up.
I named the model after my mother’s father, Roy Rewold. He wasn’t an economist, but as the first mayor of his town as well as a small business owner, he embodied the values of hard work and care for his common man that I try to imbue in our culture at Atlas Analytics. Naming our first algorithm after him was my way of grounding cutting-edge technology in the timeless principles he lived by.
From Idea to Reality
In Q2 2025, ROY forecast U.S. GDP growth at +4.3% while the Atlanta Fed’s GDPNow model was stuck at +2.4%. The Bureau of Economic Analysis released its first estimate at +3.0% before revising it to +3.3%, with the final number coming out later this month.
At first glance, it seemed we had overshot. But when the revision came closer to our number, it showed what we’d seen all along: Atlas Analytics saw the signals early.
That we caught the signal early before the consensus was a powerful proof point: real-world signals, seen from above, can give us a truer, faster read on the economy.
What’s Next for Atlas Analytics
From a chance encounter at Brookings to forecasting the economy in real time, Atlas Analytics has come a long way. But we’re just getting started.
In the months ahead, our focus is threefold. First, we’re raising capital from VCs and professional angels to scale our platform and accelerate product development. Second, we’re expanding our pilot programs with hedge funds, institutions, and corporations to validate new applications for our models. And third, we’re preparing for our formal go-to-market launch this winter, when our real-time economic intelligence platform will be available to a wider set of clients.
The vision remains the same: to move beyond lagging indicators to a world where real-world signals guide how we understand the economy.
See the Economy Before the Headlines
Subscribe to Atlas Analytics Weekly for early insights into GDP, trade, and real-time macro signals or reach out if you’d like to explore our pilot programs with hedge funds, institutions, or corporates.