
Big Trouble for Big Tech
Party like it’s 1999… Or is it 2001?

At Wednesday’s highs, the Technology Select Sector SPDR ETF (XLK) traded just shy of $199 per share.
By Friday’s close, it had fallen to approximately $180, erasing nearly $20 per share in less than two trading sessions.
For readers of Atlas Analytics, the pullback should not come as a surprise.
Two weeks ago, we warned clients that technology equities had become increasingly disconnected from the pace of underlying economic growth. Friday’s selloff does not invalidate that thesis. If anything, it may represent the first stage of a broader repricing.
Even after the decline, Atlas estimates the fair value of the XLK at approximately $151 per share. In other words, despite one of the sharpest technology selloffs of the year, we still estimate that investors are paying roughly 20% above what current economic fundamentals justify.
The question is no longer whether technology stocks can decline.
The question is whether the market has fully reconciled expectations with reality, or whether Friday was simply the beginning.
A Growing Disconnect Between Markets and Fundamentals
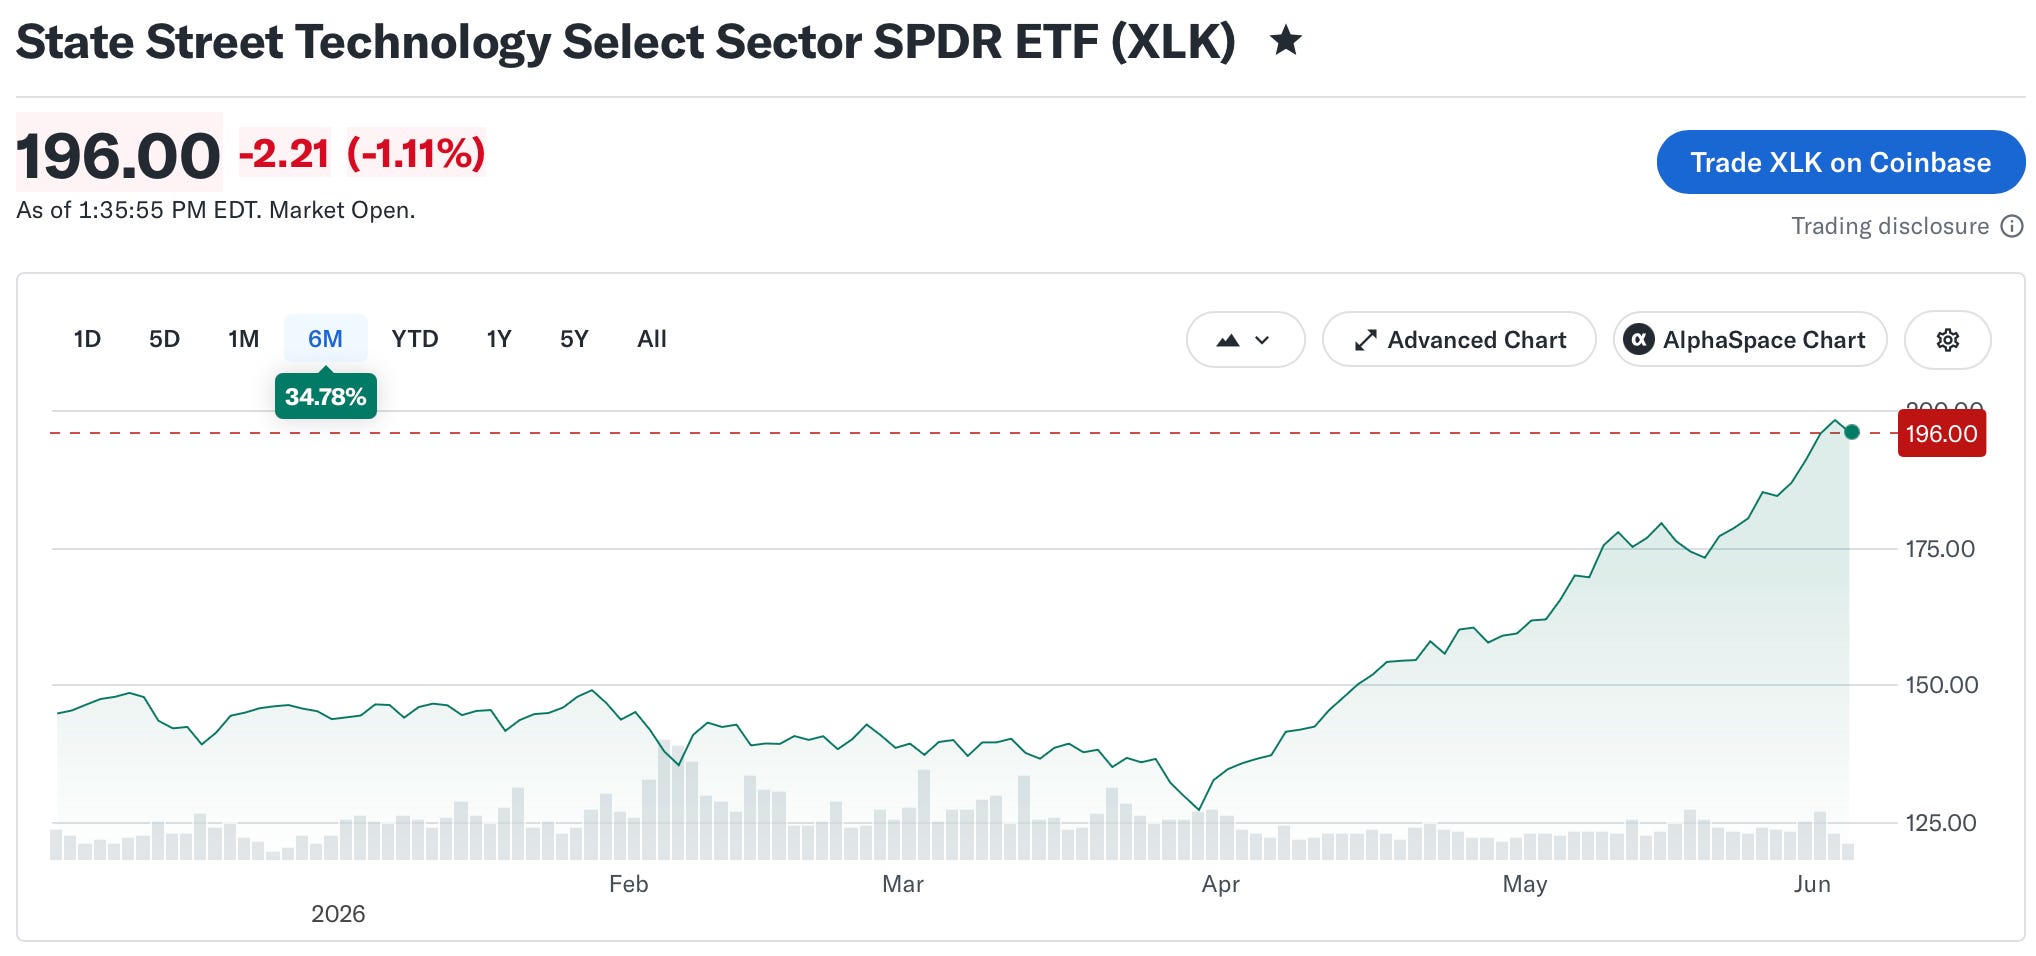
Big Tech has rallied 35% over the past 6 months through Wednesday’s highs, the majority of which has happened since April.
Although economic growth has improved, it remains far from extraordinary.
Recall that Q4 2025 GDP ultimately clocked-in at a somewhat dismal 0.5% growth, and Q1 2026 is currently in the books at 1.6% (recall that we predicted 2.0% approximately two weeks before the first release, which was 2.0%). Privately with our clients, we are currently forecasting growth around 2.5% for Q2, suggesting that economic activity is improving, but is hardly gangbusters.
In contrast, the XLK (State Street’s Tech ETF), VGT (Vanguard’s Tech ETF), and the QQQ (the NASDAQ-tracking ETF) were all up by huge margins:
XLK: +35.7% YTD (as of COB Wednesday)
VGT: +31.6% YTD (as of COB Wednesday)
QQQ: +21.1% YTD (as of COB Wednesday)
The divergence between economic growth and technology equity performance is difficult to ignore.
We believe the market is currently closer to 2001 than 1999.
Not because valuations are as extreme as they were during the Dot-Com Bubble, but because investor expectations increasingly appear detached from the pace of economic growth.
The Correlation Between GDP and Tech, Again
As we’ve written about extensively throughout this periodical, equity prices do not exist in a vacuum. In fact, there is what we have termed “the invisible tether” that relates economic fundamentals (as measured by GDP) to macro-exposed ETFs.
In the chart above, the invisible tether is between GDP and the XLK, State Street’s tech-based, macro-exposed ETF.
As the chart above shows, GDP (as measured by the seasonally adjusted annualized rate, the same formulation used by the Bureau of Economic Analysis to calculate it) is nearly 50% correlated with the quarterly price change in the XLK.
In plain English, periods of stronger economic growth tend to coincide with stronger technology-sector returns, while weaker growth tends to coincide with weaker returns.
Thus, if you know GDP ahead of the government releases (as Atlas believes we do), one can use the past association with macro-exposed ETFs to predict the fundamental value of that security.
And what is the fundamental value of the XLK currently?
Using our proprietary GDP forecasts and financial factor models, we believe the fair-value price of the XLK should be around $150.73.
As of COB on Friday, the XLK was trading at $180.30.
Therefore, Atlas Analytics estimates that even after Friday’s rout where it dropped by nearly 7%, the XLK is still overvalued by approximately 20% relative to current economic fundamentals. We reach similar conclusions for the QQQ, while most other major ETFs remain much closer to fair value.
So is this a bubble?
Fortunately, investors do not have to guess. Markets have confronted similar episodes before.
To understand where we may be headed, it is useful to revisit the last great technology mania.
An Imperfect Historical Analog
When investors think about the Dot-Com Bubble, they often remember the spectacular collapse that followed. What is less remembered is how compelling the underlying story appeared at the time.
The internet was transforming commerce. Communication was becoming instantaneous. Entire industries were being reinvented. The productivity gains that followed were very real and ultimately reshaped the global economy.
The problem was not the technology.
The problem was valuation.
By the late 1990s, investors had become convinced that the future would be dramatically different from the present. Technology stocks increasingly became priced not on current earnings or economic fundamentals, but on expectations of future growth.
Eventually, reality caught up with those expectations.
Economic growth slowed. Corporate profits failed to keep pace with investor optimism. Investors began asking a question they had largely ignored during the boom:
“How much of this future growth has already been priced into today’s prices?”
The result was severe. From its peak in March 2000 to its trough in October 2002, the NASDAQ Composite lost nearly 80% of its value.
However, we believe investors should be cautious about drawing a direct parallel between that period and today.
Unlike many of the speculative internet companies of the late 1990s, today’s technology leaders are highly profitable businesses generating enormous amounts of revenue and free cash flow. Collectively, the Magnificent Seven currently trades at approximately 28 times forward earnings, elevated relative to the broader market, but nowhere near the extreme valuations observed during the height of the Dot-Com Bubble.
Moreover, the U.S. economy today remains fundamentally healthy. Atlas currently estimates second-quarter GDP growth of approximately 2.5%, a far cry from the deteriorating economic backdrop that accompanied the 2000 to 2002 bear market.
For these reasons, we do not believe the most likely outcome is an 80% collapse in technology equities.
What concerns us is something more subtle.
Investors appear to be pricing years of future AI-driven productivity gains into today’s valuations before those gains have meaningfully appeared in the underlying economic data.
If those expectations prove too optimistic, or simply take longer to materialize than investors currently expect, the result may not be a crash, but rather a prolonged period of disappointing returns as fundamentals gradually catch up to prices.
The lesson of 2001 is not that transformative technologies fail.
The lesson is that investors can be right about the technology and still wrong about the price.
How We’re Trading It With Capital-At-Risk
If our analysis is correct, a natural question follows:
What causes the market to recognize the disconnect between technology valuations and economic fundamentals?
The honest answer is that we do not know.
Markets rarely announce their turning points in advance. In hindsight, every correction appears obvious. In real time, the catalyst is almost always unexpected.
There are, however, several plausible scenarios:
The first is that investors simply become less optimistic about the geopolitical outlook. A significant portion of the recent rally appears to have been driven by improving sentiment surrounding the Trump administration and the possibility of a de-escalation of tensions with Iran. If that optimism proves premature, risk assets could quickly reprice.
The second is inflation.
Although inflation has moderated considerably from its post-pandemic highs, it remains above the Federal Reserve’s long-run target. Any renewed acceleration in price pressures could force markets to reconsider expectations for monetary policy and interest rates, placing pressure on some of the market’s highest-valued growth assets.
The third is earnings.
Technology valuations ultimately depend upon extraordinary future profit growth. If AI-related revenues, margins, or adoption rates fail to meet investor expectations, even modest earnings disappointments could trigger a reassessment of valuations.
Atlas is not betting against technology, artificial intelligence, or innovation.
Rather, we are betting that economic fundamentals ultimately matter.
The timing of any correction remains unknowable. What can be observed, however, is a growing divergence between technology valuations and the economic activity that has historically supported them.
As a result, Atlas has reduced exposure to the most richly valued segments of the technology sector and maintains a cautious stance toward assets whose prices appear increasingly dependent upon future expectations rather than present fundamentals.
Earlier this week, Atlas established bearish positions through XLK and IWM put options. Those positions benefited from the recent pullback. Nevertheless, we have only partially reduced exposure and continue to maintain downside positioning because our models suggest technology equities remain meaningfully above fair value.
We may ultimately prove wrong. AI may generate a wave of productivity growth that exceeds even today’s optimistic assumptions.
But if history teaches anything, it is that investors are often willing to pay too much for even the best ideas.
For now, Atlas remains positioned for a narrowing of the gap between technology valuations and economic fundamentals. Whether that adjustment occurs through slower prices, stronger growth, or some combination of both remains to be seen.
Atlas Analytics is a satellite-based macroeconomic forecasting company that provides real-time macro intelligence for decisions that move markets. ROY (Remote Orbital Yield) and JACK (Joint Algorithm for Containerized Knowledge) are Atlas’s proprietary algorithms powered by satellite imagery, AI/ML, and computer vision.
This article was written with valuable assistance from Morgan Reppert, Chief of Staff, and Aditya Murlidharan, Economic Analytics & Executive Operations Fellow for Atlas Analytics.