

Every quarter, economists, investors, policymakers, and journalists wait for the same number: U.S. GDP growth.
Within minutes of its release, the number is dissected. Did the economy beat expectations? Is growth accelerating or slowing? What does it mean for the Federal Reserve? Markets can move, forecasts are updated, and narratives about the economy begin to take shape.
But there is an important caveat: the first GDP estimate is not the final word on how fast the economy grew.
It can’t be.
Measuring an economy as large and complex as the United States in something close to real time is an extraordinary statistical undertaking. When the Bureau of Economic Analysis (BEA) publishes its initial estimate, some of the information needed to calculate GDP is incomplete or not yet available. As more comprehensive data arrive, the BEA updates its estimates.
Those revisions can be meaningful.
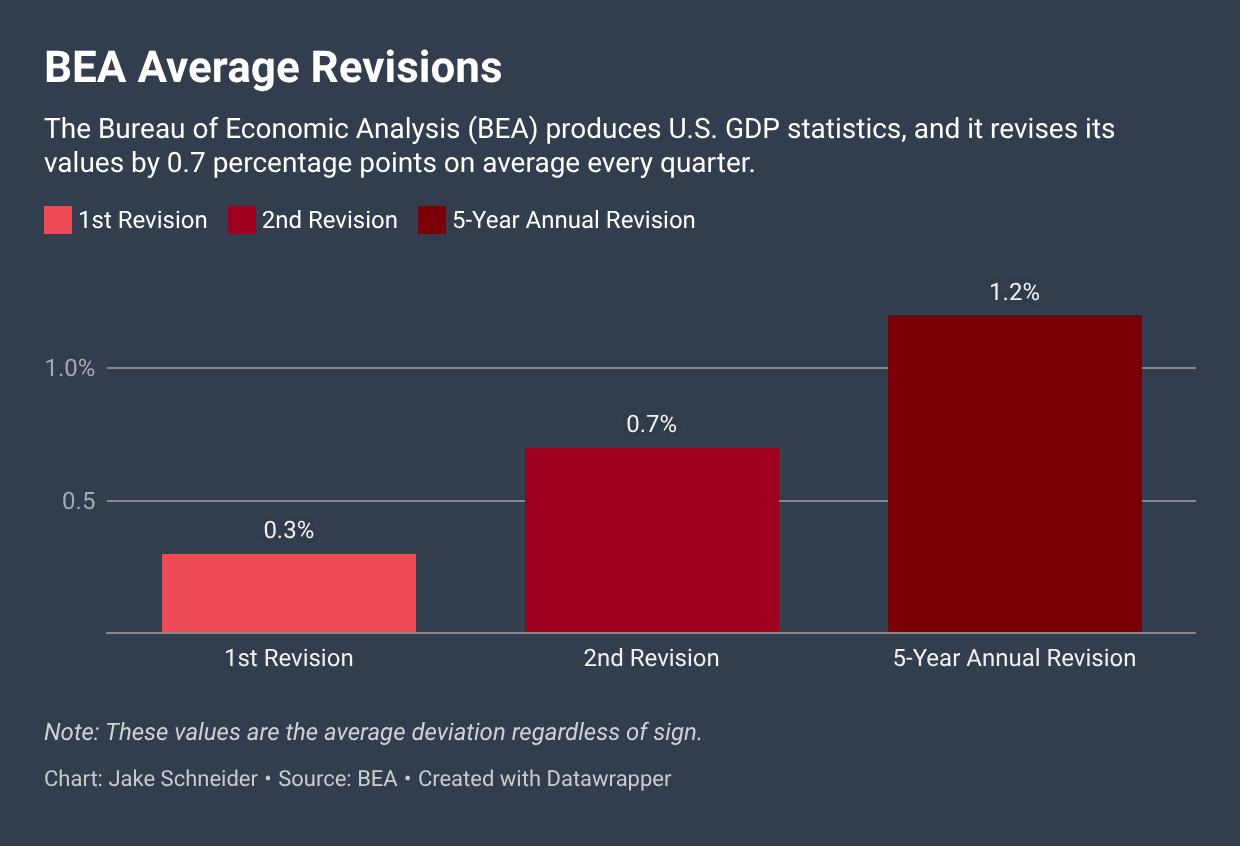
As the chart above shows, BEA estimates are revised by an average of approximately 0.3 percentage points in the first revision, 0.7 percentage points in the second, and 1.2 percentage points over a five-year period.
For an economy whose long-run growth rate is measured in just a few percentage points per year, those aren’t trivial differences.
Imagine an initial estimate showing the economy growing at a 2.0% annualized rate. A revision of even several tenths of a percentage point can meaningfully change our assessment of the quarter. Around economic turning points, revisions can be even more consequential for understanding whether the economy was accelerating, stagnating, or contracting.
Why GDP gets revised
Revisions aren’t a flaw in the system. They reflect a fundamental tradeoff in economic measurement: speed versus completeness.
If we wanted to know exactly what happened in the economy, we could wait until nearly every business survey, tax record, trade report, construction estimate, and other underlying dataset was complete.
But a GDP estimate arriving years after the fact wouldn’t be particularly useful to a policymaker deciding what to do today or an investor deciding where to allocate capital.
So statistical agencies produce the best estimates they can using the information available at the time. As better and more complete information arrives, those estimates improve.
That raises an interesting question: Can we expand the information available to us earlier?
A New Economic Information Set
For most of modern economic history, measuring the economy has depended heavily on businesses, households, and governments reporting what happened.
Today, we have another possibility: observing portions of economic activity directly.
Satellite imagery can reveal changes in construction, industrial facilities, transportation networks, ports, and other physical infrastructure. Geospatial datasets can help identify where economic activity is occurring. Shipping and logistics data can provide signals about the movement of goods. Other high-frequency datasets can capture activity long before traditional statistics are finalized.
None of these sources replaces official economic statistics.
A satellite cannot tell us how much households spent on healthcare last quarter. It cannot directly measure wages, software investment, or the enormous service economy. And alternative datasets introduce their own measurement challenges, biases, and noise.
But they can provide independent signals about parts of the economy while the traditional data picture is still incomplete.
That distinction matters.
Forecasting the Present
We normally think of economic forecasting as trying to answer a question about the future: What will the economy look like next quarter or next year?
But there is another problem that is arguably just as important:
What is happening in the economy right now?
Economists call this nowcasting.
The difficulty of nowcasting is easy to underestimate. By the time we learn the official GDP estimate for a quarter, that quarter has already ended. And, as the history of revisions demonstrates, our understanding of what happened can continue changing long afterward.
This means that nowcasting is not simply a forecasting problem. It is also a measurement problem.
The opportunity presented by new forms of data is therefore not to replace the national accounts. It is to complement them: to add information to the economic picture sooner.
At Atlas Analytics, that’s the problem we’re working on. We combine satellite imagery, geospatial data, and traditional economic information to measure economic activity before the official picture is complete.
Better real-time measurement won’t eliminate uncertainty. No dataset can.
But if we can observe more of the economy as it happens, we can make better estimates of the present, and potentially make better decisions about the future.
Work With Us
Satellite-based macroeconomic forecasting isn’t just about GDP.
Atlas uses proprietary machine-learning and satellite-imagery models to measure economic activity from above. We are currently taking on a select number of projects to explore how these capabilities can be applied to specific industries, assets, and investment questions.
Have a use case where better real-time economic visibility could matter? Reach out to connect.