
Warren Buffet Is Wrong. Market Timing Is Possible.
Atlas Analytics’ Weekly Subscriber Update

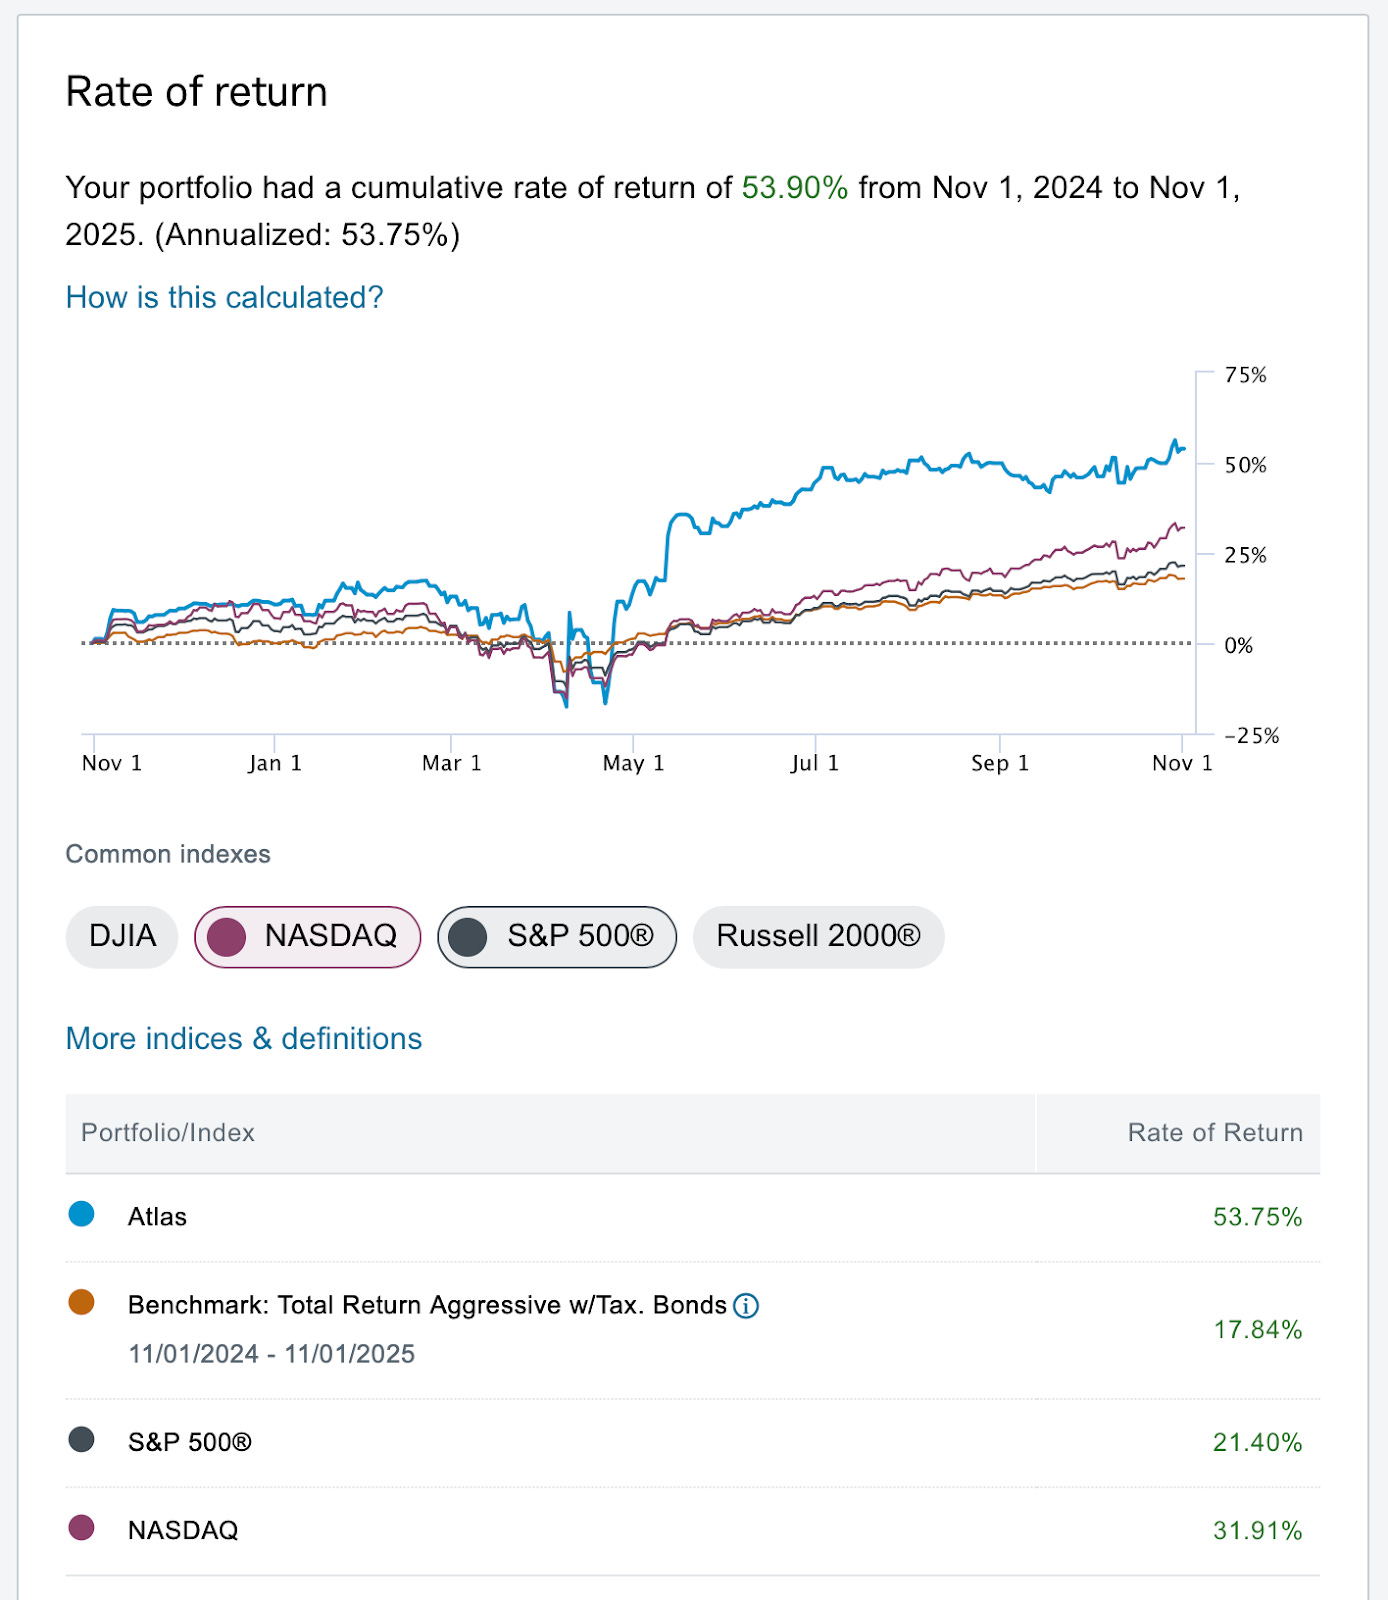
Source: Atlas Analytics’ Schwab Account (Nov. 1, 2024 through Nov. 1, 2025)
Warren Buffett, the Sage of Omaha and one of the most prolific investors of all time, has an old saying:
“It’s not timing the market. It’s time in the market.”
Buffett was right for his era. But the signal revolution has changed the game.
The Signal Revolution
What is the signal revolution?
It’s the shift from intuition-based investing to data-driven foresight — turning raw information into predictive signals.
Buffett’s era was about time in the market.
Our era is about timing the market using the signal.
Now, to be clear: long-term compounding still matters. Dividends, reinvestment, and the relentless math of compounding are as powerful as ever. Einstein even called compound interest, “man’s greatest invention.”
Where conventional wisdom goes wrong is in the antiquated belief that market timing is impossible.
As Atlas Analytics is now demonstrating in real time: market timing is not only possible — it’s profitable.
The Myth of Market Timing
The days of blind security selection devoid of information about the business cycle are over.
Using satellites constantly orbiting Earth, Atlas Analytics has created an algorithm that ingests the raw imagery to make predictions about U.S. (and eventually global) GDP growth rates.
Using these GDP nowcasts, which we currently have for Q4 (which we will publish in early January), we are able to use the “invisible tether” between economic activity and financial markets to create price targets for the equity markets.
When financial prices are below these targets, we buy; when they are above, we sell (and even sell short).
For most of this year, we bought, including after Trump’s re-election conventional wisdom said to sell, citing tariffs, the war in Ukraine, and economic uncertainty.
For the past few weeks, the financial markets have soured as predicted two months ago in our post, Mr. Market is now over his skis.
Now we’re going long again as the equity markets are currently under-valued.
Atlas Analytics vs. the Market
The Result: Atlas Analytics’ portfolio is up 54% since November 2024.
This is not a fluke or an accident. This is proof that market timing is not only possible; it’s lucrative.

Why Atlas Analytics Is Different
Every professional investor I’ve spoken to (and I speak to a lot lately) has said the same thing: the alternative-data space is crowded, and most claims of alpha don’t hold up. I agree with them: 99% of these products are noise. That’s why I built Atlas Analytics differently.
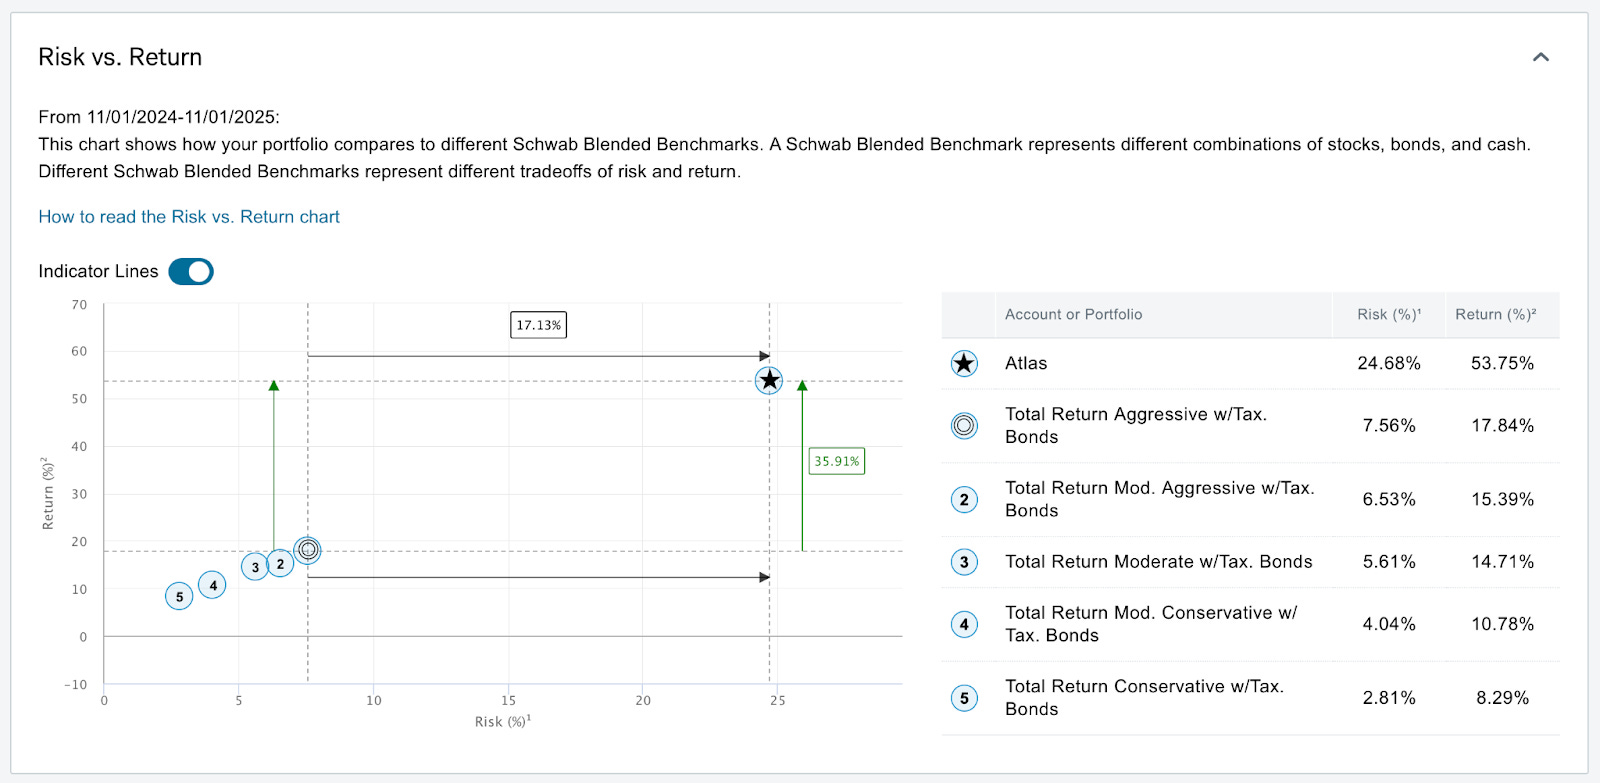
Source: Atlas Analytics’ Schwab Account (Nov. 1, 2024 through Nov. 1, 2025)
I’ve been trading live on Atlas Analytics’ model for the past year and a half. The results so far: Since November 2024, our portfolio is up +53.75% with an annualized volatility of 24.68% and a Sharpe ratio of 2.03. This isn’t back tested; this is capital at risk.
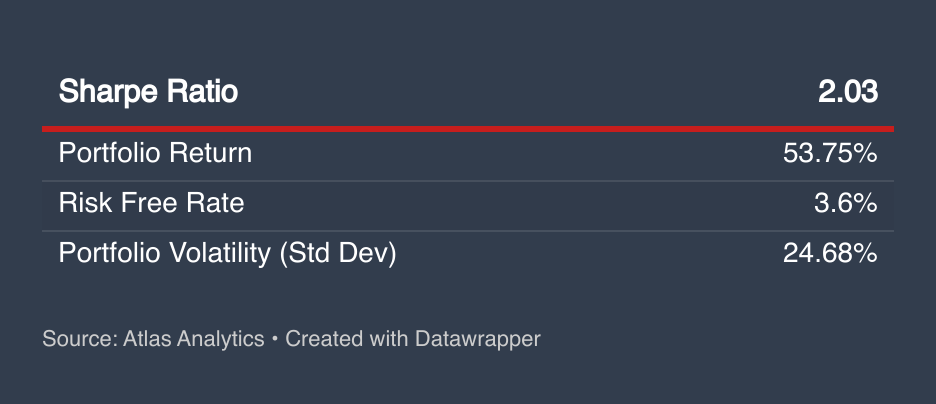
What is the Sharpe ratio? As a measure of risk to return (total gain less the risk-free rate divided by portfolio standard deviation), it denotes how effective an investor is at generating gains per unit of risk.
Basically, a Sharpe above 1 is good, above 2 is great, and above 3 is exceptional. Most profitable hedge funds aim for a Sharpe ratio between 1.5 and 2.5. Atlas Analytics, at 2.03, is already in hedge-fund quality territory, and we’re just getting started.
Institutions want to see a long, consistent track record. I’m building that quarter by quarter, with the same rigor a fund would use, so the persistence becomes clear over time.
Satellite imagery is abundant. What differentiates Atlas is the platform we’ve built that turns raw pixels into usable macroeconomic indicators at scale. The value is in an automated system that delivers consistent, reliable macro signals clients can use directly.
Atlas is building a track record that strengthens every quarter. As the results compound, the question naturally shifts to scale and impact.
For decades, the consensus was that market timing was impossible. With Atlas Analytics, that consensus is crumbling. The only real question now is: how far can we go? I invite you to join the debate, and the journey.
Bonus Content for Our Premium Subscribers
What We’re Seeing Now: A Preview of Q4 and Its Equity-Market Implications
Every quarter, Atlas Analytics updates its GDP nowcast using the latest satellite imagery, and geospectral signatures embedded in the Landsat program. Although our full Q4 estimate will be released in early January, our in-progress read on the quarter is already clear enough to guide positioning.
