
The “Rubber Band” Theory of Finance
Financial Market Sentiment Is Wrong Based Upon Economic Fundamentals. Buy the Dip.

TLDR:
In the second part of this three part series, I introduce my “Rubber Band” Theory Between Economics and Finance.
As economic and financial markets are interconnected through economic gravity, I term this as the “Rubber Band” Theory.
Econometric data correlates GDP growth to major stock indices’ performance, creating opportunity for investors to utilize Atlas Analytics’ stock price targets.
Atlas Analytics’ ROY algorithm empowers investors with GDP forecasting data allowing them to time the market.
Wayne Gretzky said it best: “I skate to where the puck is going to be, not where it has been.”
So too is this advice true for finance. Ok, perhaps a bit cliche, but the intuition remains: if you know where the economy is heading (thanks to Atlas Analytics’ ROY algorithm), then you should have a good idea of where the financial markets are heading as well.
Introducing the “Rubber Band” Theory Between Economic and Financial Markets
One of the core ratios in finance is the Price-Earnings Ratio (“P/E”). The idea is a simple one: this multiple relates an equity’s stock price (the “P”) to its underlying earnings (the “E”) and therefore signals how expensive or cheap the stock is relative to its economic performance. Sure, some stocks (such as technology and so-called “meme stocks”) operate at a greater multiple than other companies that are more conservatively marked, but all equities apply to the same gravity effect between their economic performance (i.e. earnings) and the value investors are willing to pay for ownership of it (i.e. price).
What is economic gravity?
If a stock becomes too expensive relative to its earnings, its pricing becomes brittle and ripe for savvy investors to take their profits with them. Likewise, if a stock becomes too beat down in price due to negative sentiment, bad news, or other non-fundamental reasons, eventually prudent investors will recognize that the P/E ratio is attractive and buy the stock, bidding up the equity. This is financial gravity: venture too far into a stock price’s stratosphere, and economic gravity forces the equity back to fundamental reality.
So how does this economic gravity apply to the stock market writ large?
In the same way that an individual stock has a P/E ratio relating its trading price to its economic performance, the stock market also has a P/E ratio.
When the stock market indices (such as the S&P 500, the Dow Jones Industrial Average, and the technology heavy NASDAQ) become too expensive relative to their economic performance, the market feels this and sells off. Likewise, when positive economic news and optimistic public sentiment imbue Keynes’ proverbial “Animal Spirits” for future economic growth, the market rallies, and the indexes rise.
Enter the “Rubber Band” Theory Between Economic and Financial Markets: there is an elastic, organic relationship that relates the economy’s performance to the stock market price it commands. This multiple between economic activity adjusts over time and, as is often stated about the stock markets in general, is forward-looking. In short, future economic performance yields future stock market valuations.
The “P” (price) in the Rubber Band Theory is trivially obvious: it’s the broad stock market indices’ overall price (i.e. the S&P’s, Dow’s, or NASDAQ’s index value).
The “E” (earnings) is less obvious but even more intuitive: it’s GDP. Just like an individual stock relates its P/E ratio between its trading price and its earnings, the stock market’s trading price is a direct function of the economy’s earnings (i.e. its GDP).
We all know this intuitively. When GDP growth is strong, both consumers and businesses have additional capital to invest which translates (either directly or indirectly) into higher individual stock values. (Even if consumers don’t buy a single equity, their increased purchasing power translates into increased consumption, which translates into higher earnings for the companies they shop at, which commands a greater stock price by investors through the P/E ratio we discussed above).
The result is like a rubber band: the valuation that relates the stock market to GDP “stretches” between a range of multiples but can ultimately only bend and flex between certain values. When the rubber band stretches too far (i.e. the valuation of the market becomes too high relative to GDP), the indices “snapback”; correspondingly, when the rubber band becomes too lax, prudent investors “buy the dip,” pushing the equity markets back up.
Don’t believe me? The empirics bear this out.
The Empirics Behind the “Rubber Band” Theory
The econometrics and charts show this relationship is true.
Take the example of the S&P 500. An investor can’t directly invest in the S&P, but you can invest in ETFs (Exchange Traded Funds) that mirror the S&P. Given its low expense ratio and daily offerings of option contracts, of the few ETFs that track the S&P, I personally like State Street’s SPDR ETF, the SPY.
Let’s look at the chart of the last ~25 years of data relating GDP to the SPY (percentage change):
It’s obvious that there’s an association between the two, and the correlation coefficient is nearly 0.93 between GDP and the SPY (where 0 is no correlation and 1 is a perfect linear fit).
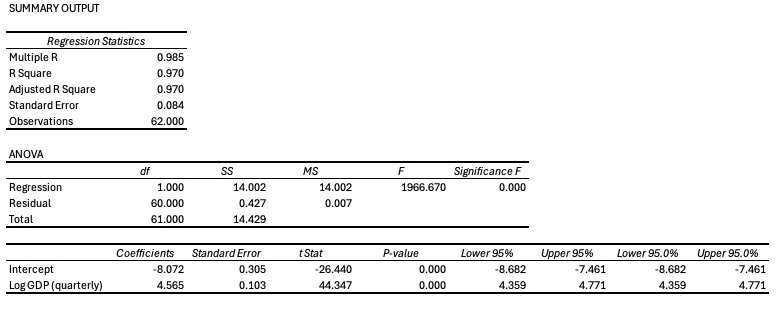
To further validate this relationship, I’ve employed the econometric technique called regression to mathematically model the input variable (GDP) to the output variable (the SPY). The specifics of the regression aren’t too important (DM me for a copy of the econometrics, and I’ll be happy to share), but the key is the “goodness of fit.” When I regress the log of GDP on the log of the SPY since 2009 using quarterly data, I obtain an adjusted R-squared of 97%, suggesting that the 97% of the variation in the SPY is explained by GDP. Even more convincingly, the t-statistic on the GDP variable is 44, inferring that it’s nearly impossible this relationship is a coincidence. (Of course, this is a simple bivariate regression but when I control for other factors such as inflation and the Federal Funds Rate, similar statistical power remains).
Even more profound, the relationship between Core GDP (the term I termed in my previous Substack post “The US Economy Is Not Heading for a Recession Yet”) predicts stock index prices even better!
This econometric relationship is true for the QQQ (NASDAQ) and DIA (Dow Jones Industrial Average) as well, empowering Atlas Analytics to employ our GDP forecasts to predict targets for all of the major stock markets.
“I Skate to Where the Puck Will Be”: Forecasting GDP to Predict Stock Market Valuations
If you know where the economy is heading, you can use these econometric relations to model a price target for the associated stock index.
As I wrote about in my first article in this series, Atlas Analytics uses the Landsat program to create a weekly update to Core GDP (I share these weekly updates with a select group of partners every Sunday; DM me if interested).
Given the “Rubber Band” Theory of Economic and Financial Markets, effectively every week we have an update to the “E” of the broad indices’ P/E Ratio. By plugging this into the regression model, I can model the fundamental value level for the markets.
If the market is above its Atlas Analytics’ target, sell or short it; if the market is below, buy or select call options.
Here are last week’s stock price and econometric target values (DM me for this week’s):
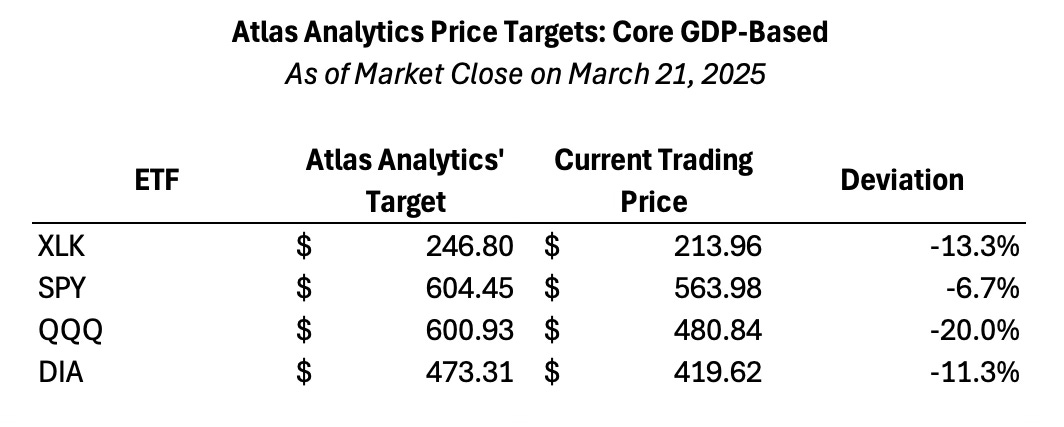
As of two weeks ago, the market was very oversold; my data today suggests an even greater buying opportunity.
How I Trade Atlas Analytics (And You Can Too)
When everyone was selling during the week of March 10, I bought five calls on the XLK and three calls on the QQQ dated to May 16.
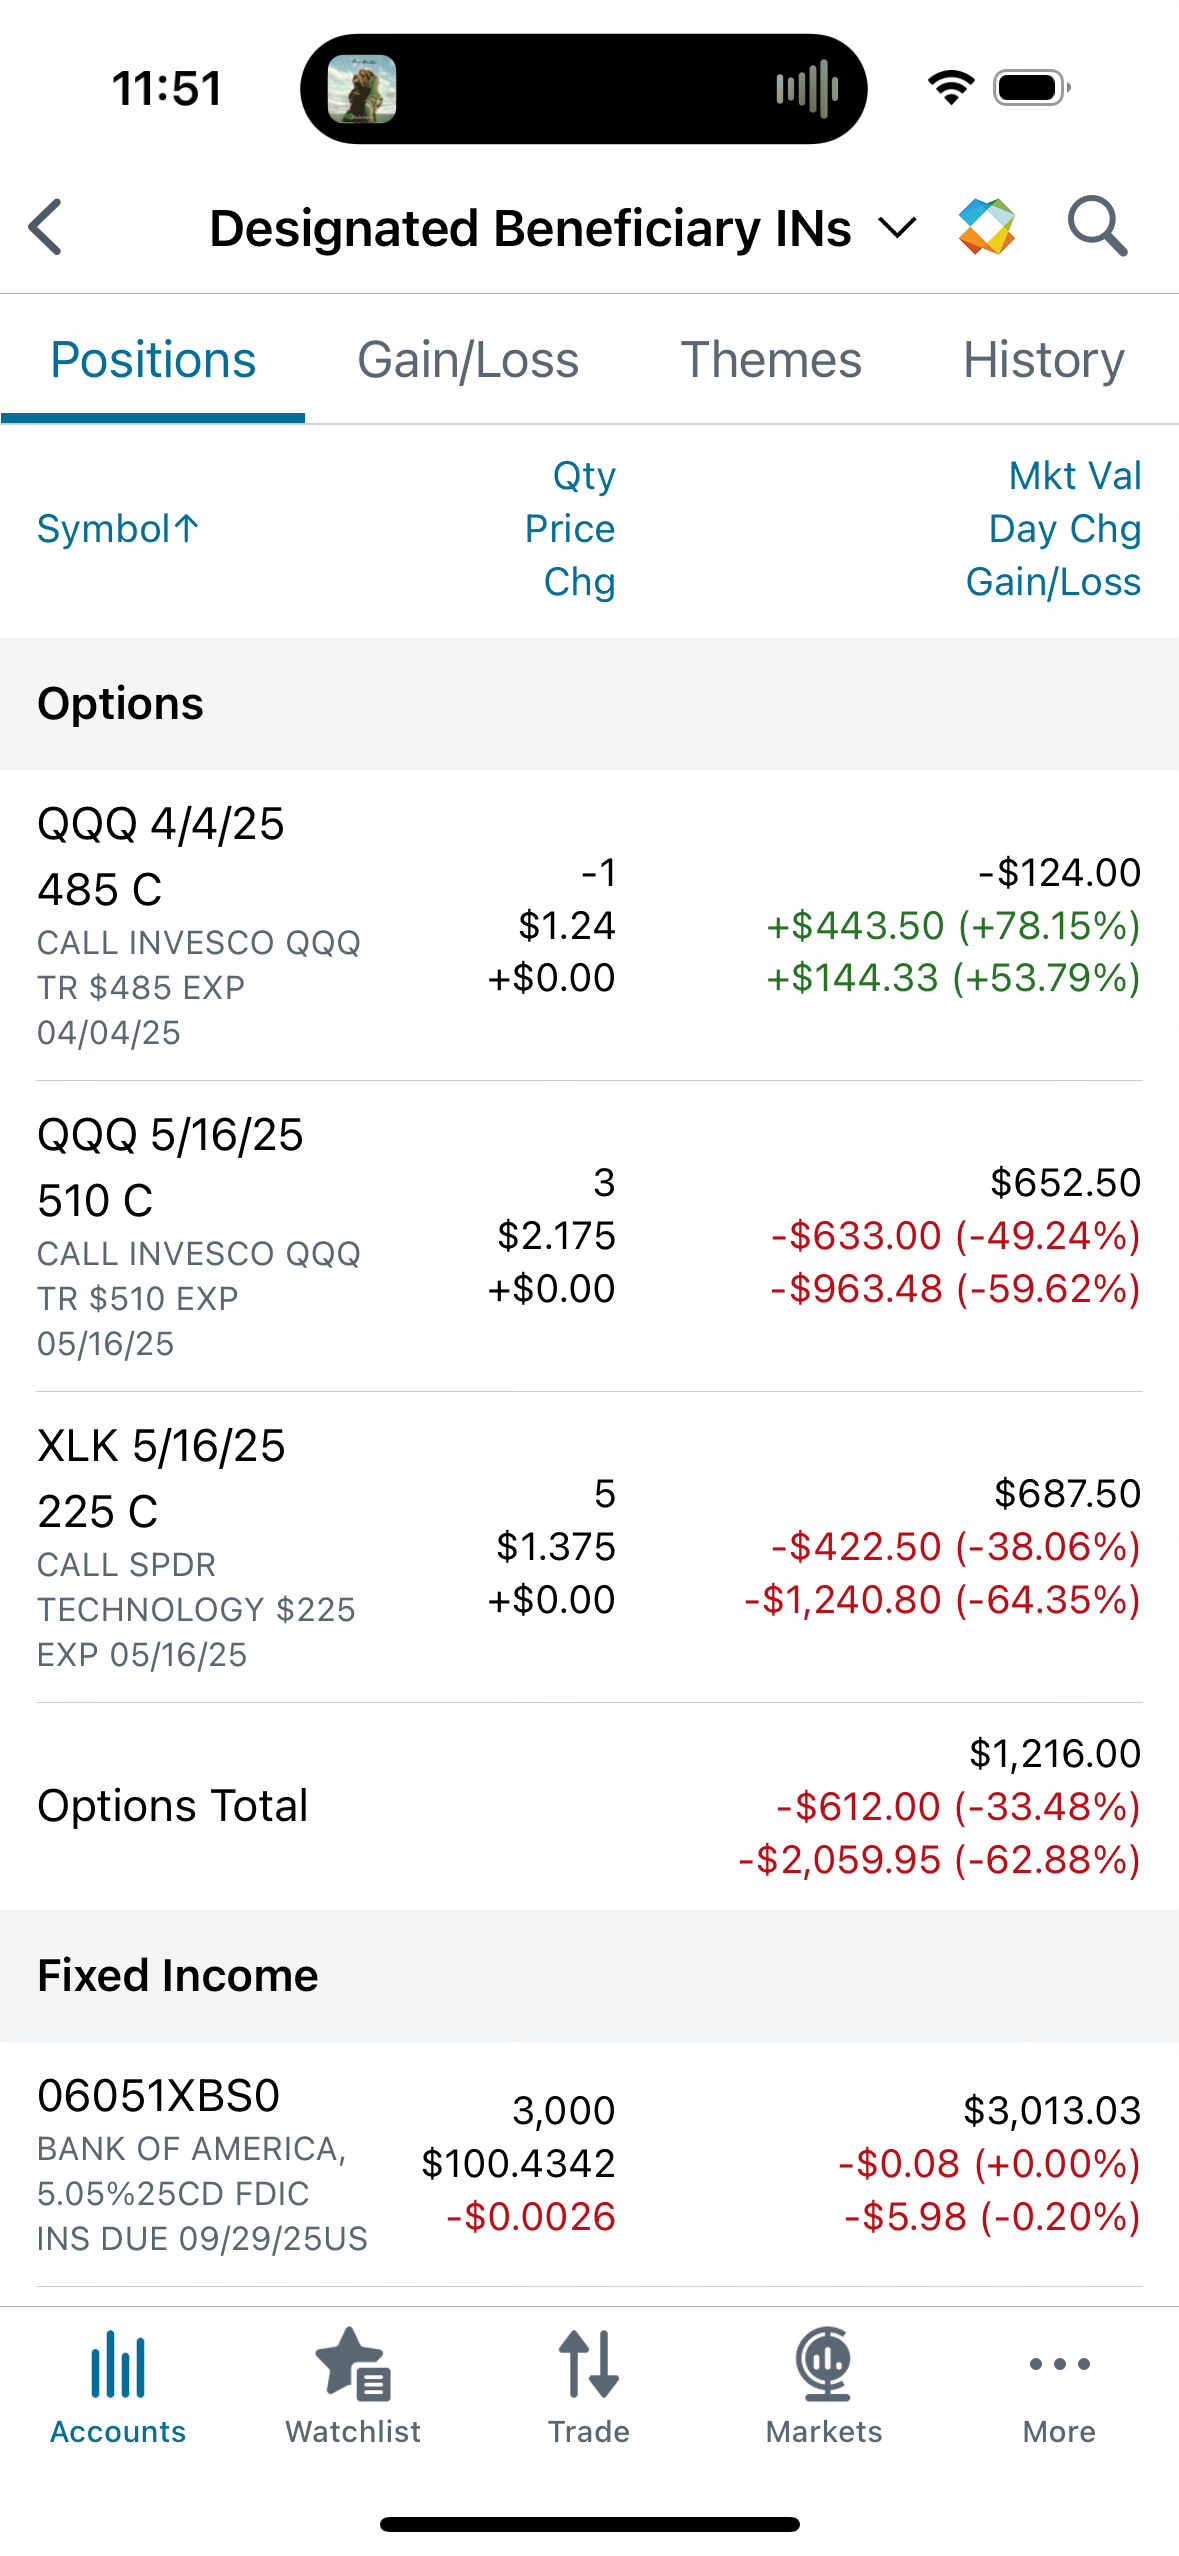
(I also sell Covered Calls against 100 shares of the QQQ. More on that in a later post).
At the time, the QQQ was at approximately $478 and the XLK at $209; now, after Friday’s deleterious declines, they’re at $469 and $206, yielding a 64% and 63% loss. Of course, a loss isn’t a loss until you realize it.
But I have confidence in my GDP forecasts as well as my financial market targets so I’ve (bravely) shared my less-than-successful trades so far with the hope that the markets will rebound before mid-May.
Of course, as Lord John Maynard Keynes famously stated: “The market can remain irrational longer than you can remain solvent.”
So what should you do?
That depends on your risk tolerance, investment horizon, personal comfort with different investment strategies, and ability to time the market. If you’d like to talk it over, DM me and we can chat.
Conclusion
The "Rubber Band" theory between Economic and Financial Markets highlights the elastic relationship between economic performance and stock market valuations. As GDP fluctuates, stock prices typically follow with the P/E ratio functioning like a rubber band that connects everything. Supporting data garnered through econometrics correlates economic activity and financial market indices. With the Atlas Analytics' platform, investors can leverage GDP forecasts to predict stock market movement and targets, potentially generating opportunities to time the market.
To stay ahead of the curve and gain access to our exclusive real-time GDP and financial forecasts, consider subscribing to Atlas Analytics Premium. Visit us at atlasanalytics.com for more information or reach out directly to discuss how we can help optimize your investment approach.