

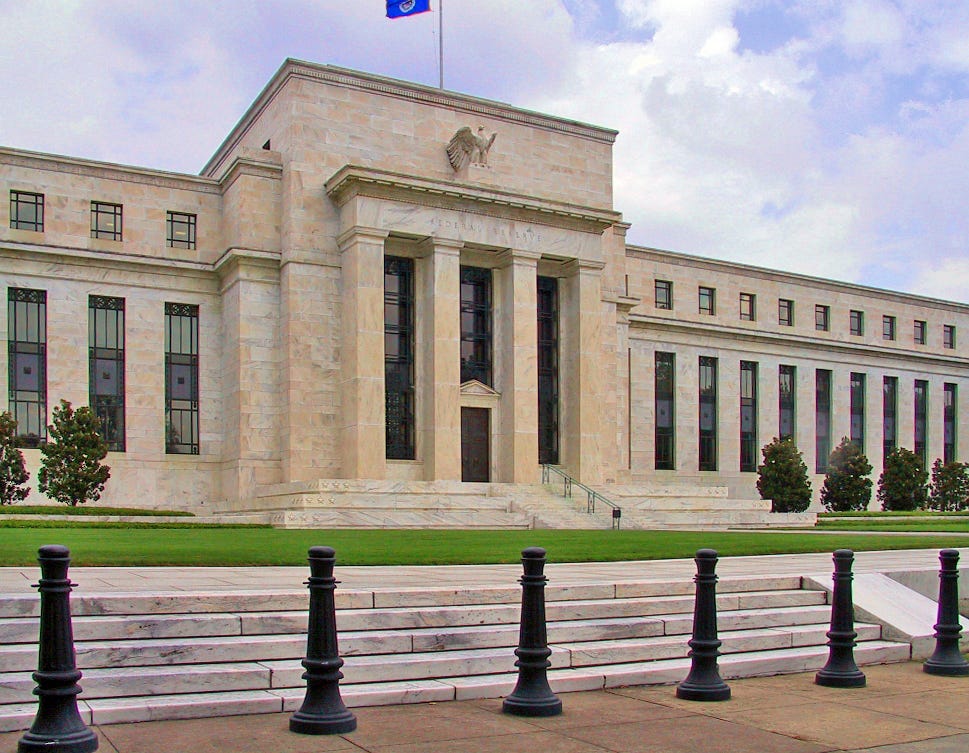
The September Decision
On September 16, the Federal Reserve raised its target range for the federal funds rate by 25 basis points, to 3.75%–4%. The vote was unanimous. The Fed described an economy expanding at a solid pace, supported by resilient spending and robust capital investment. Inflation remained elevated.
The decision depended on a familiar challenge: judging where the economy is headed with information that is incomplete at the time. Some indicators arrive quickly but cover only part of the picture. Broader measures take longer to publish and may later be revised.
That is why the quality and timing of economic data matter for policy. A clearer view of current activity could help the Fed tell a lasting change from a temporary one.
What the Five Task Forces are Examining
In July, Fed Chair Kevin Warsh announced five task forces to review how the central bank conducts monetary policy. Each will examine current practices and provide findings to the Federal Open Market Committee.
Communications will review how the Fed explains its decisions and deliberations when the outlook is uncertain.
Balance sheet policy will examine the costs and benefits of the Fed’s current system for maintaining ample reserves, along with other ways to implement monetary policy.
Data sources will look for more accurate and timely signals about the economy, including new sources of information and changes to data gathering methods. This is the task force most relevant to Atlas: its work concerns what policymakers can know before official statistics provide a fuller account.
Productivity and jobs will assess how technologies such as AI affect output, investment, employment, and the economy’s capacity to grow.
Inflation frameworks will revisit how the Fed identifies and responds to the forces behind rising prices.
The task forces have not announced policy changes. They are examining the tools the Fed uses and the evidence behind its decisions.
Where Atlas Fits
Atlas Analytics studies what satellite imagery can reveal about economic activity as it happens. ROY analyzes changes in the built environment and land use to estimate economic activity. JACK uses computer vision to measure container activity at ports and inform trade estimates.
Those observations can add detail to a national figure. Strong domestic activity, for example, can coincide with a drag from trade. Growth in one region can mask weakness in another. Understanding the components and geography of a forecast can be as useful as the headline number.
Satellite imagery requires careful interpretation. A visible change at a site does not, by itself, establish its economic meaning. The resulting signals need to be modeled, compared with other evidence, and tested over time. The Fed has not endorsed Atlas or identified satellite imagery as a preferred source. Its data task force is asking a broader question: whether additional sources can give policymakers a more timely and reliable picture of the economy.
The Question After the Rate Hike
The September increase reflected the Fed’s judgment that inflation remains too high while the economy continues to expand. Future decisions will require the same judgment with a changing and incomplete set of facts.
Official statistics remain the benchmark. The opportunity for Atlas is to provide additional, testable observations during the period before those statistics arrive.
Love your posts Jake! QQ- Are mortgage rates considered data inputs or outputs of their decision-making? Smiles…