

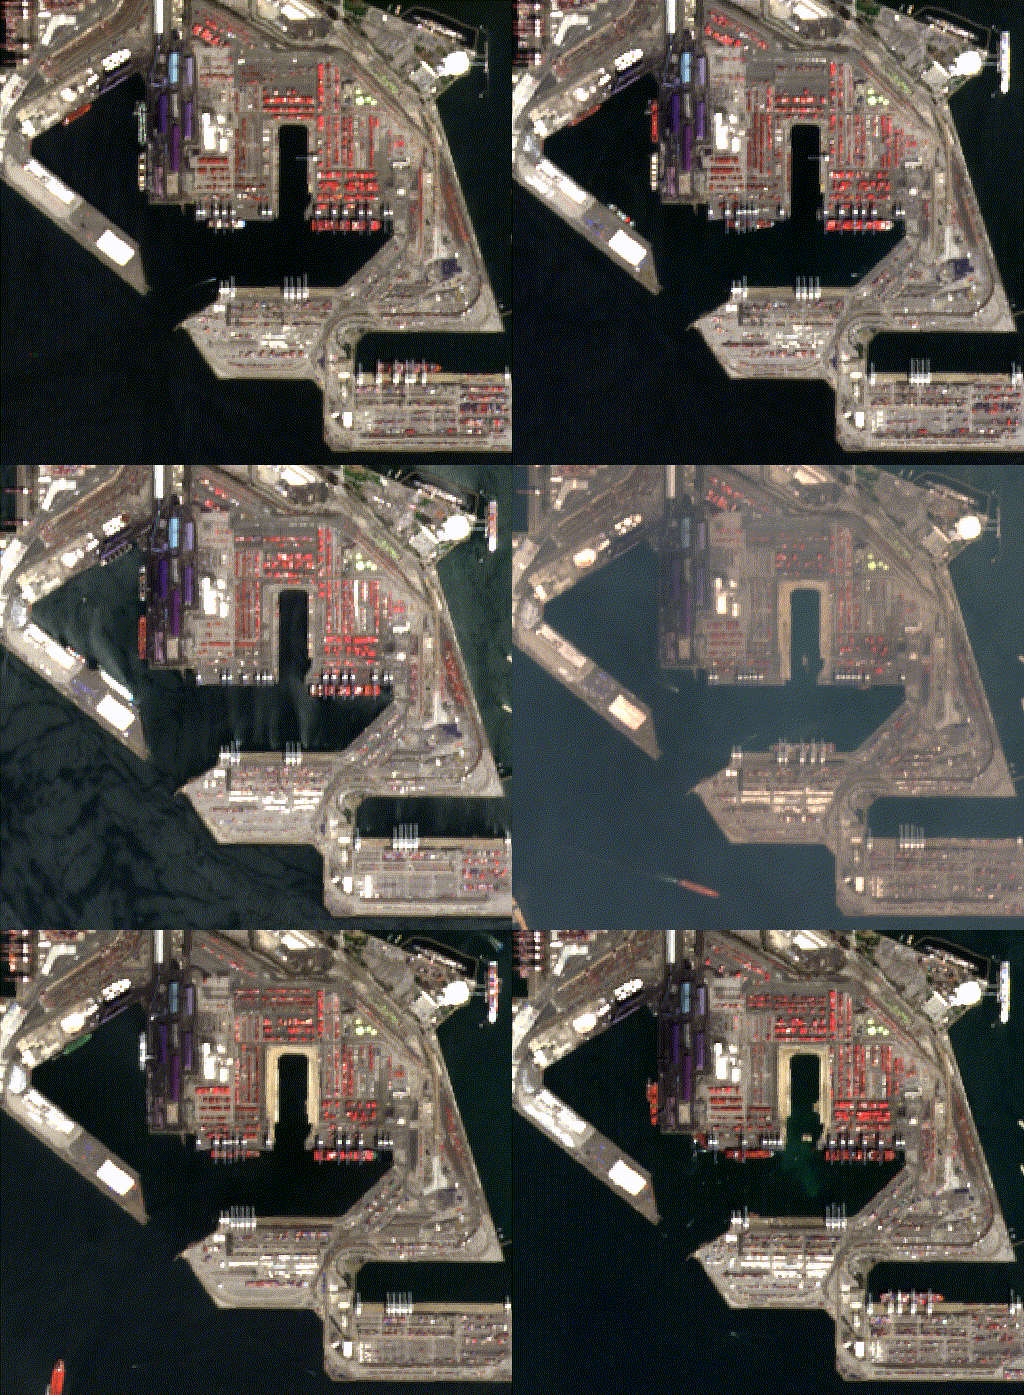
For most of modern economic history, measuring the economy has meant asking people what happened.
Government agencies survey households and businesses. Companies report financial results. Customs authorities record shipments. Statistical agencies collect, clean, aggregate, revise, and eventually publish the data.
This system is extraordinarily valuable. It is also, almost by construction, backward-looking.
GDP is the canonical example. We spend enormous amounts of time debating what the economy is doing right nowusing statistics that describe activity weeks or months in the past. Even the first estimate of quarterly GDP arrives after the quarter has ended, and that estimate is subsequently revised as better information becomes available.
But something fundamental has changed.
Increasingly, we don’t have to ask the economy what happened.
We can observe it.
Satellites can see construction sites expand. Ships can be tracked entering and leaving ports. Aircraft movements reveal changes in travel and commerce. Nighttime lights provide information about economic activity. Vegetation indices tell us about agricultural conditions. Digital exhaust—from searches, transactions, mobility, and other sources—provides another layer of information about what households and businesses are doing.
The interesting question is no longer whether these datasets contain economic information.
They do.
The harder question is how to turn millions of noisy physical observations into economically meaningful signals.
From economic statistics to economic sensing
Traditional economic measurement generally starts with a conceptual framework.
Define consumption. Define investment. Define exports. Then construct systems for measuring those quantities.
Alternative data often reverses that process.
You begin with something observable: a parking lot, a container terminal, a factory roof, a crop field, a ship.
Then you ask: what economic variable does this observation tell us something about?
That distinction sounds subtle, but I think it represents a meaningful change in how economists can approach measurement.
Consider a port.
Traditional statistics might eventually tell us the dollar value of goods imported through it. But before those statistics are released, satellites and other sensors can observe vessels, containers, vehicles, storage areas, and physical changes in the facility.
None of those observations is imports.
But collectively they contain information about imports.
The job of the economist becomes translating physical activity into an economic concept.
That is economic sensing.
Satellite imagery isn’t magic
There is an understandable temptation to think that sufficiently sophisticated AI applied to satellite imagery can simply “see GDP.”
It can’t.
A satellite observes reflected electromagnetic radiation. GDP is an accounting construct.
There is an enormous modeling problem between the two.
In fact, one of the biggest lessons I’ve learned from working with geospatial data is that the economic model matters at least as much as the imagery.
Suppose a satellite observes significantly more activity around a manufacturing facility.
Is production increasing?
Maybe.
Or perhaps inventory is accumulating because demand has collapsed. Perhaps construction is occurring. Perhaps the imagery reflects a seasonal pattern. Perhaps atmospheric conditions changed the measurement.
Remote sensing provides observations. Economics provides interpretation.
That is why I suspect the most valuable applications of alternative data will come not from replacing economists with computer vision models, but from combining domain knowledge, econometrics, machine learning, and increasingly powerful observation systems.
The evidence is accumulating
This isn’t merely theoretical.
Researchers have been using nighttime lights as proxies for economic activity for years. More recently, improvements in satellite coverage, computing power, machine learning, and data accessibility have made much richer applications possible.
An IMF working paper published this year, for example, examined satellite measures including vegetation, nighttime and daytime lights, and nitrogen dioxide alongside machine-learning techniques for estimating Venezuelan GDP. The authors found that incorporating satellite information improved the performance of their random-forest model.
Another IMF study applied satellite indicators, including nighttime lights, NO₂ emissions, precipitation, and vegetation measures, to GDP nowcasting in Cambodia, where timely conventional economic statistics are more limited.
And research published this summer on Morocco combined nontraditional information including satellite imagery, Google Trends, and flight-tracking data. The enriched models reduced out-of-sample errors relative to conventional benchmarks across measures of agricultural activity, tourism revenues, and unemployment.
These applications are particularly powerful in countries where official statistics are delayed or incomplete.
But I don’t think their relevance ends there.
The real opportunity is granularity
The most interesting advantage of alternative data may not actually be speed.
It may be resolution.
GDP tells us what happened to the United States.
But investors, companies, and policymakers frequently care about much smaller units.
What is happening around a particular logistics hub?
Is construction activity accelerating in one metropolitan area but slowing in another?
Are factories in one industrial corridor behaving differently from the national manufacturing sector?
Is activity increasing around a particular asset?
Traditional economic statistics become progressively thinner as you move from country to state to county to company to individual physical asset.
Satellite imagery moves in almost exactly the opposite direction.
The Earth can increasingly be observed at extremely high spatial and temporal resolution.
That creates the possibility of building economic indicators from the ground up rather than merely disaggregating national statistics from the top down.
Official statistics aren’t going away
None of this means GDP statistics, surveys, or government statistical agencies become obsolete.
Quite the opposite.
Alternative data needs authoritative benchmarks.
A satellite-derived indicator may tell us that activity appears to be accelerating. Official statistics ultimately tell us what that activity meant economically.
The relationship is therefore complementary.
Traditional statistics provide carefully constructed measurements of the economy.
Alternative data provides another set of sensors capable of detecting changes before, or below the level at which, those measurements become available.
Put them together and economic measurement potentially becomes faster, more granular, and more resilient.
Economics is becoming an observational science
Astronomers don’t survey stars about their temperature.
Meteorologists don’t ask clouds whether it is raining.
They build instruments that observe the physical world and models that translate those observations into useful information.
Economics is obviously different. Human behavior cannot be reduced to remote sensing, and many of the things economists care about, expectations, prices, wages, welfare, institutions, cannot simply be photographed from space.
But a surprisingly large portion of economic activity leaves a physical footprint.
Factories produce emissions.
Consumers drive to stores.
Developers pour concrete.
Farmers grow crops.
Ships move goods.
Cities consume electricity.
Aircraft carry passengers.
Mines move earth.
For the first time, we are developing the technological infrastructure to observe much of that activity continuously and at enormous scale.
The next generation of economic data may therefore look very different from the last one.
It won’t eliminate surveys, national accounts, or traditional econometrics.
It will add something economists historically haven’t had:
the ability to watch parts of the economy happening in real time.