

Two Thursdays ago, the Bureau of Economic Analysis (BEA) released its Advance Estimate of U.S. GDP for the second quarter of 2026. As always, economists, investors, and policymakers immediately began comparing forecasts against the official number.
For Atlas Analytics, our final forecast, published on July 13, more than two weeks before the release, projected:
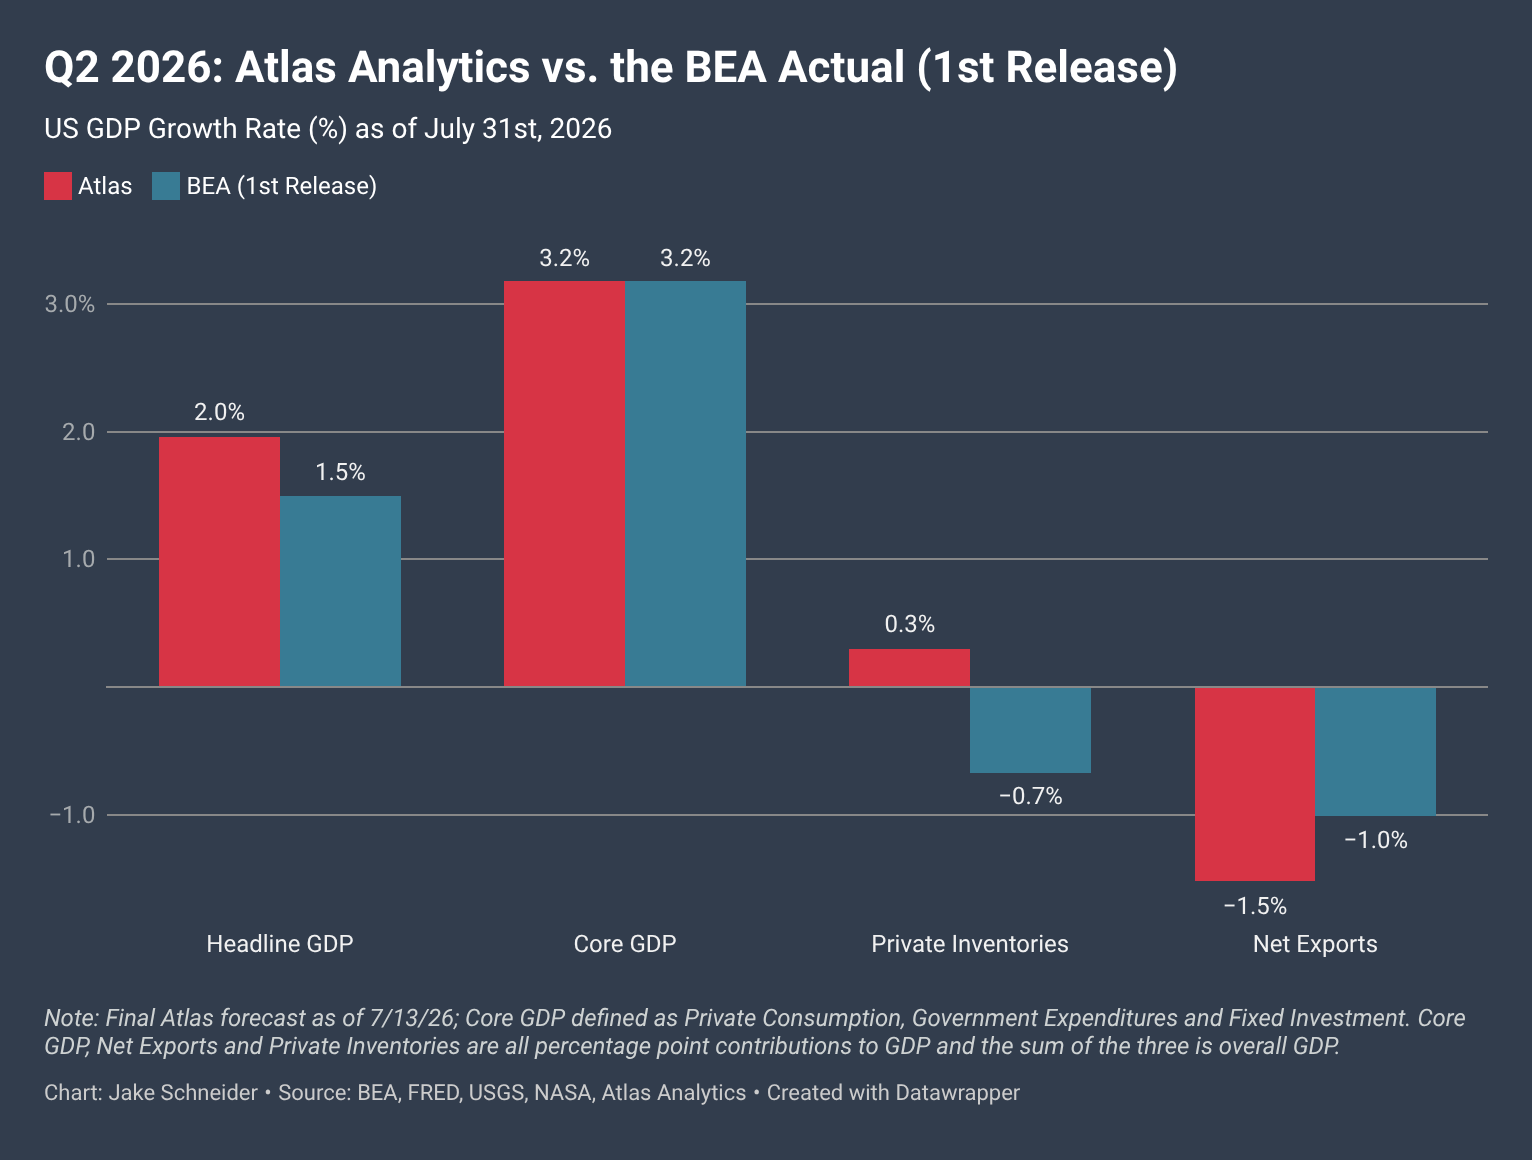
Headline GDP: 2.0%
Core GDP: 3.2%
Private Inventories: 0.3 percentage points
Net Exports: -1.5 percentage points
The BEA’s Advance Estimate came in at:
Headline GDP: 1.5%
Core GDP: 3.2%
Private Inventories: -0.7 percentage points
Net Exports: -1.0 percentage points
While these comparisons are interesting, they raise a broader question that often gets overlooked:
What should we actually benchmark a GDP forecast against?
GDP Isn’t Measured Once
Unlike many economic indicators, GDP is not published once and left unchanged.
Instead, every quarter goes through a sequence of revisions:
Advance Estimate
Second Estimate
Third Estimate
Annual revisions
Comprehensive benchmark revisions
The number reported on release day is simply the BEA’s best estimate using incomplete information. As additional surveys, trade statistics, inventory reports, tax records, and other source data become available, the estimate evolves.
In other words, even the government’s “official” GDP release is itself revised over time.
Why GDP Revisions Matter
This creates an important challenge when evaluating any GDP forecasting model.
Should a forecaster be judged against the BEA’s Advance Estimate? The Second Estimate? The Third Estimate? Or the benchmarked values published years later?
Each answers a slightly different question.
The Advance Estimate matters because it is the first number markets react to. But it is also produced using incomplete information. As additional source data become available, including more complete trade statistics, inventories, business surveys, and administrative records, the BEA updates its estimate to better reflect underlying economic activity.
Historically, these revisions have been far from trivial.
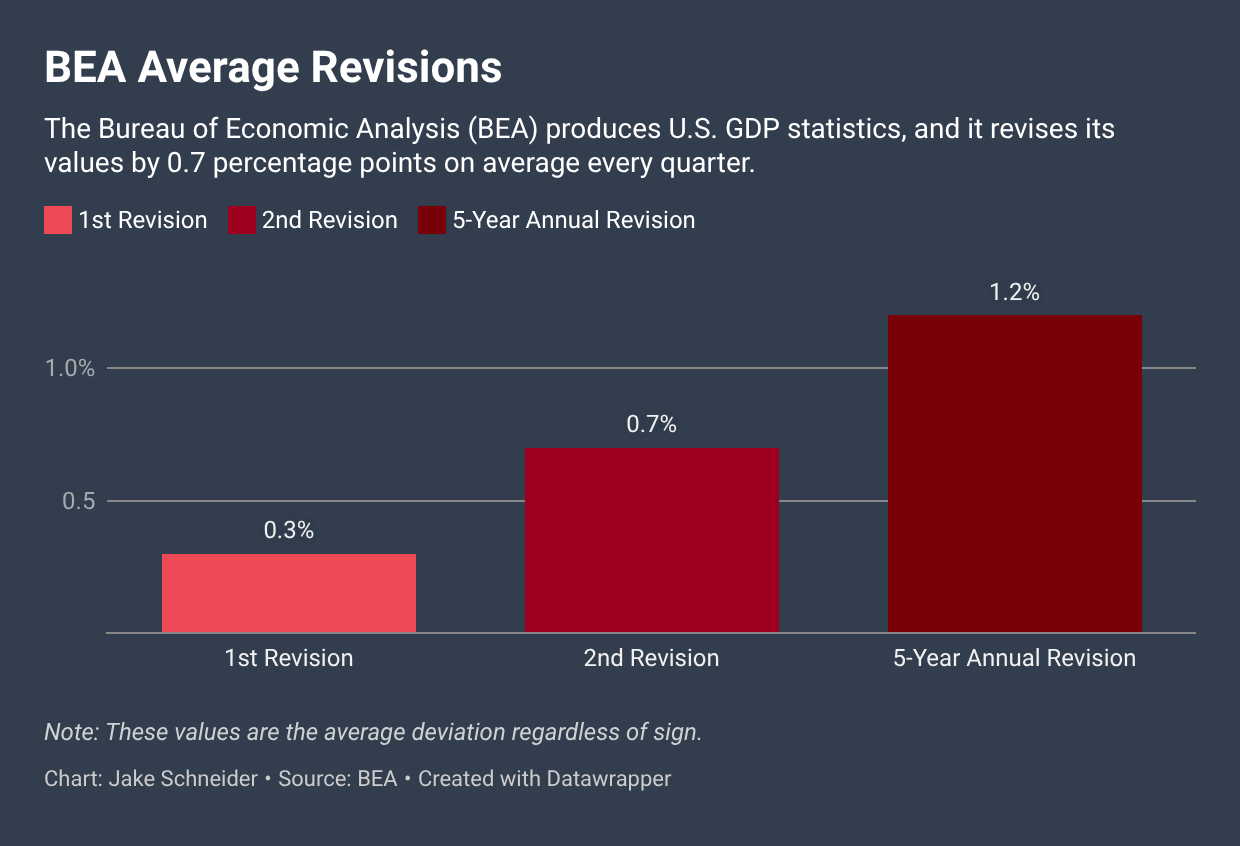
On average, the BEA revises quarterly GDP growth by approximately:
0.3 percentage points between the Advance and Second Estimates,
0.7 percentage points by the Third Estimate, and
1.2 percentage points following its five-year comprehensive benchmark revisions.
In other words, the “official” estimate released on GDP day is often only the beginning of the story.
Q2 2025 provides a good illustration. The BEA initially reported annualized GDP growth of 3.0%. One month later, the estimate was revised to 3.3%, and by the Third Estimate it had increased again to 3.8%, a cumulative upward revision of 0.8 percentage points.
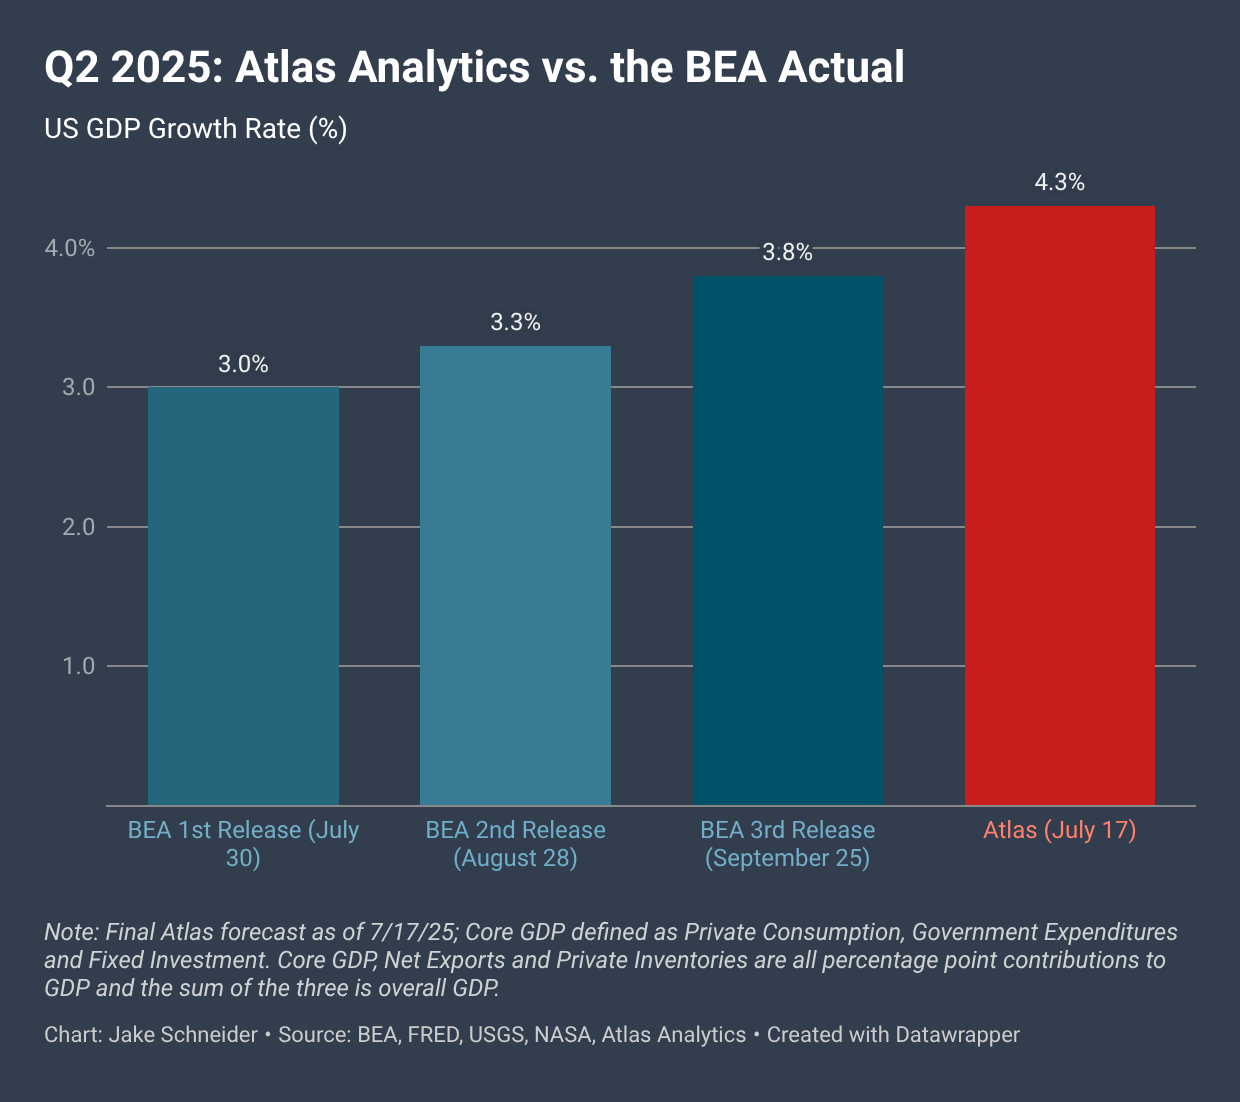
This example highlights why evaluating a real-time forecasting model solely against the Advance Estimate can be misleading. The target itself continues to evolve as better information becomes available.
For that reason, we view every GDP release as the start of the evaluation process rather than the end. We’ll compare Atlas against the Advance Estimate because that’s what markets observe in real time, but we’ll also continue tracking the forecast as the BEA revises its estimate over the coming months and years.
What Atlas Is Actually Forecasting
Atlas was never designed simply to predict what the BEA will print.
Our objective is different.
Using satellite imagery and proprietary geospatial intelligence, we’re attempting to measure underlying economic activity directly, independently of the government statistical process.
That distinction matters.
The BEA builds GDP from thousands of surveys, administrative records, and statistical assumptions. Atlas begins with a completely different information set.
Sometimes those approaches converge almost perfectly.
Sometimes they don’t.
Understanding why they differ is often just as informative as the forecast itself.
Q2 2026: A Closer Look
One aspect of this quarter that stood out was the composition of growth.
Atlas matched the BEA’s estimate for Core GDP almost exactly. The primary differences came from the more volatile components of GDP: Private Inventories and Net Exports.
That result is perhaps not surprising. These are two of the most difficult components of GDP to measure in real time because they depend on complex physical supply chains that are only partially observed through traditional economic statistics.
Net Exports
Trade is fundamentally a logistics problem.
Every quarter, millions of containers move through U.S. ports carrying imported and exported goods. Traditional trade statistics are compiled from customs declarations and administrative reporting, meaning they become available only after considerable processing.
Atlas approaches this differently.
Using our Joint Algorithm for Containerized Knowledge (JACK), we identify and count individual shipping containers directly from commercial satellite imagery at major ports across the United States. Rather than waiting for reported trade statistics, we’re able to observe physical trade activity as it occurs.

By monitoring container flows over time, JACK provides an independent measure of import and export activity that feeds directly into our estimates of Net Exports.
Private Inventories
Inventories present a different challenge.
Unlike trade, there is no single observable location where inventories accumulate. Goods are dispersed across manufacturing facilities, warehouses, distribution centers, retail locations, and transportation networks throughout the country.
As a result, inventories remain one of the most difficult components of GDP to estimate in real time.
Atlas is actively developing new computer vision capabilities designed specifically to improve our measurement of inventory accumulation and depletion. While this work is still underway, we also closely monitor each month’s Census Bureau inventory releases to refine our estimates as additional information becomes available.
Over time, we believe combining satellite-derived observations with traditional inventory statistics will provide a more complete picture of inventory dynamics than either source can offer independently.
We’ll Continue Following the Story
One of the advantages of publishing forecasts in real time is that the evaluation doesn’t stop after release day.
Over the coming months, we’ll continue comparing Atlas against each successive BEA revision while also examining what drove any remaining differences.
Forecasting isn’t just about producing a single number: it’s about understanding the economy as new information becomes available.
As the Q2 data evolve, we’ll continue sharing what we learn.