


Five weeks ago, in Big Trouble for Big Tech, we argued that technology stocks had become disconnected from the underlying economy. Using our GDP-based valuation framework, we estimated that XLK was trading nearly 20% above its fair value despite a sharp correction. We suggested that the decline could mark the beginning of a broader repricing.
Over the next two trading days, technology stocks (led by the XLK and QQQ) fell another 5%.
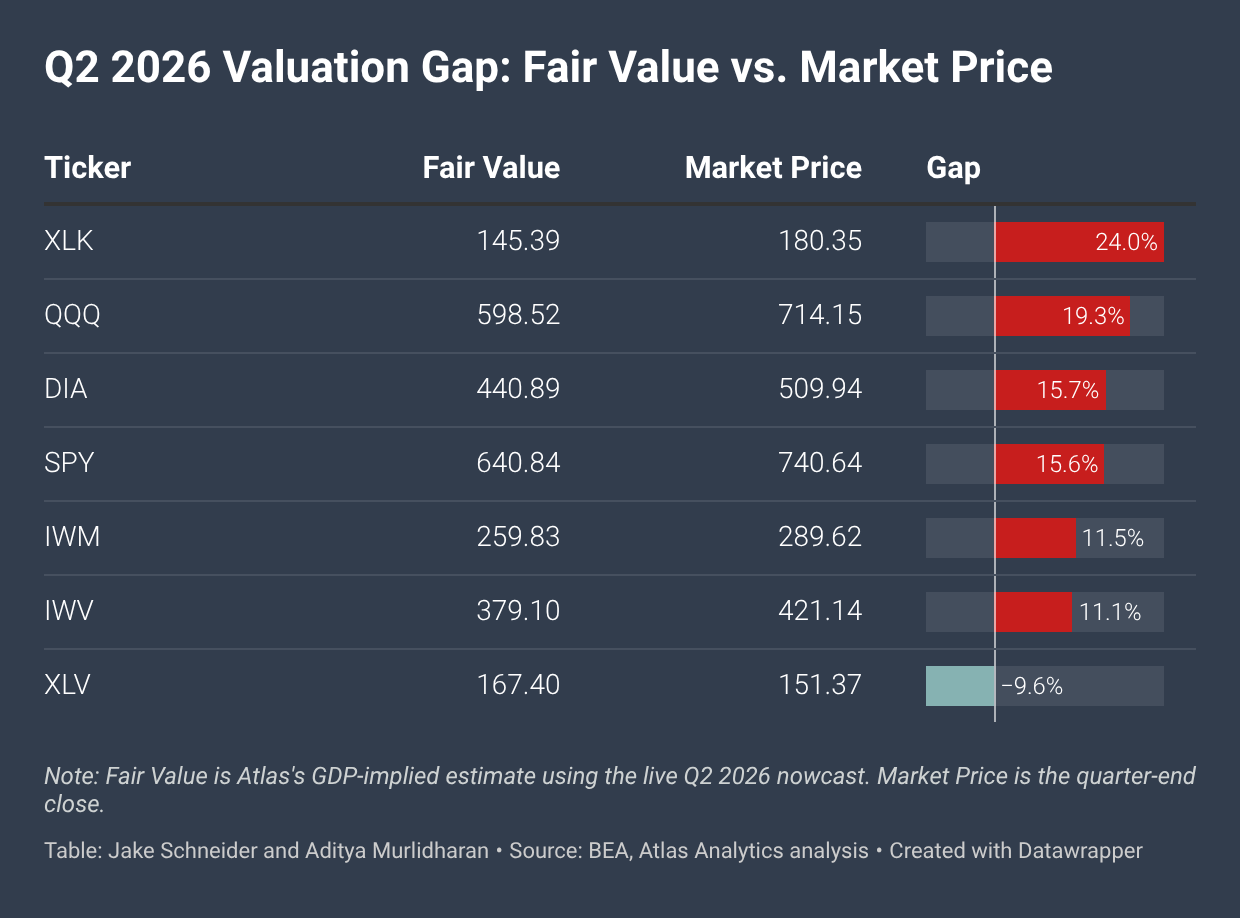
By the end of Q2 2026, our estimated fair value for XLK had fallen to $145.39, while the ETF closed at $180.35. The valuation gap widened to 24%.
That should have been the story.
It was not.
Irrational Exuberance Extends Into the Broader Market
We applied our same fair-value framework to the remaining fifteen ETFs tracked by Atlas. We expected technology to stand apart. Instead, we found that elevated valuations were visible across much of the market. Technology remained the most expensive sector, but it was no longer an outlier.
One interpretation is that markets are pricing a future economy rather than the one that exists today. Investors may expect stronger productivity growth, higher future earnings, or a structural improvement in economic performance. The rapid diffusion of generative AI and the ease with which it is being adopted across industries have strengthened those expectations. If investors believe the gains will be economy-wide rather than confined to technology, higher valuations should naturally extend beyond technology and technology-adjacent firms. Our findings are consistent with that possibility.
Alan Greenspan, our founder Jake Schneider’s first boss, famously asked whether financial markets were exhibiting “irrational exuberance.” We do not use that phrase lightly. Nor do we argue that current valuations are necessarily irrational. Our claim is narrower. Relative to today’s level of economic activity, equity markets appear to be pricing a considerably stronger economy than the one reflected in current economic activity.
That raises a simple question:
How far have market prices moved ahead of the economy that exists today?
Our framework begins with an equally simple proposition. Over the long run, corporate revenues, profits, and cash flows are constrained by aggregate economic activity. Gross Domestic Product (GDP), despite its imperfections, remains the broadest measure of that activity. If GDP can be estimated accurately before the official releases, it becomes possible to compare market prices with the level of economic output they implicitly assume. That comparison forms the foundation of this publication.
What the Numbers Show
Table 1 compares our estimated fair values with market prices for seven widely followed ETFs at the end of Q2 2026.
The results are difficult to dismiss as an isolated technology phenomenon.
XLK and QQQ remain the most expensive, trading 24.0% and 19.3% above fair value respectively. That is unsurprising.
What is more surprising is everything else. SPY and DIA, the two most widely followed large-cap benchmarks, trade roughly ~16% above fair value. IWV, representing almost the entire investable US equity market, remains more than 11.1% above fair value. Even IWM, despite representing smaller companies that have largely stayed outside the enthusiasm surrounding the largest technology firms, trades above the level implied by current GDP.
Only one ETF stands apart. XLV, representing the health care sector, trades below our estimated fair value. That’s particularly interesting given that the majority of recent hiring from the Bureau of Labor Statistics’ monthly Jobs Reports have been accrued to this single sector.
Technology therefore appears to be the extreme case, but not the only case. The difference is increasingly one of magnitude rather than direction.
Is This Just One Quarter?
One quarter proves very little.
Markets often move ahead of the economy and, at other times, fall behind it. Short-term deviations from fundamentals are therefore neither unusual nor especially informative. The more relevant question is whether the current valuation gap reflects a temporary episode or whether it forms part of a broader pattern.
To examine this, we extended the analysis beyond the latest quarter and estimated GDP-implied fair values across the historical sample for all sixteen ETFs using the current Atlas valuation models. Rather than asking whether markets appear expensive today, we ask a simpler question: how has the relationship between market prices and underlying economic activity evolved over time?
Chart 1 reports the results for XLK. We focus on technology because it provides a useful illustration of the broader exercise.
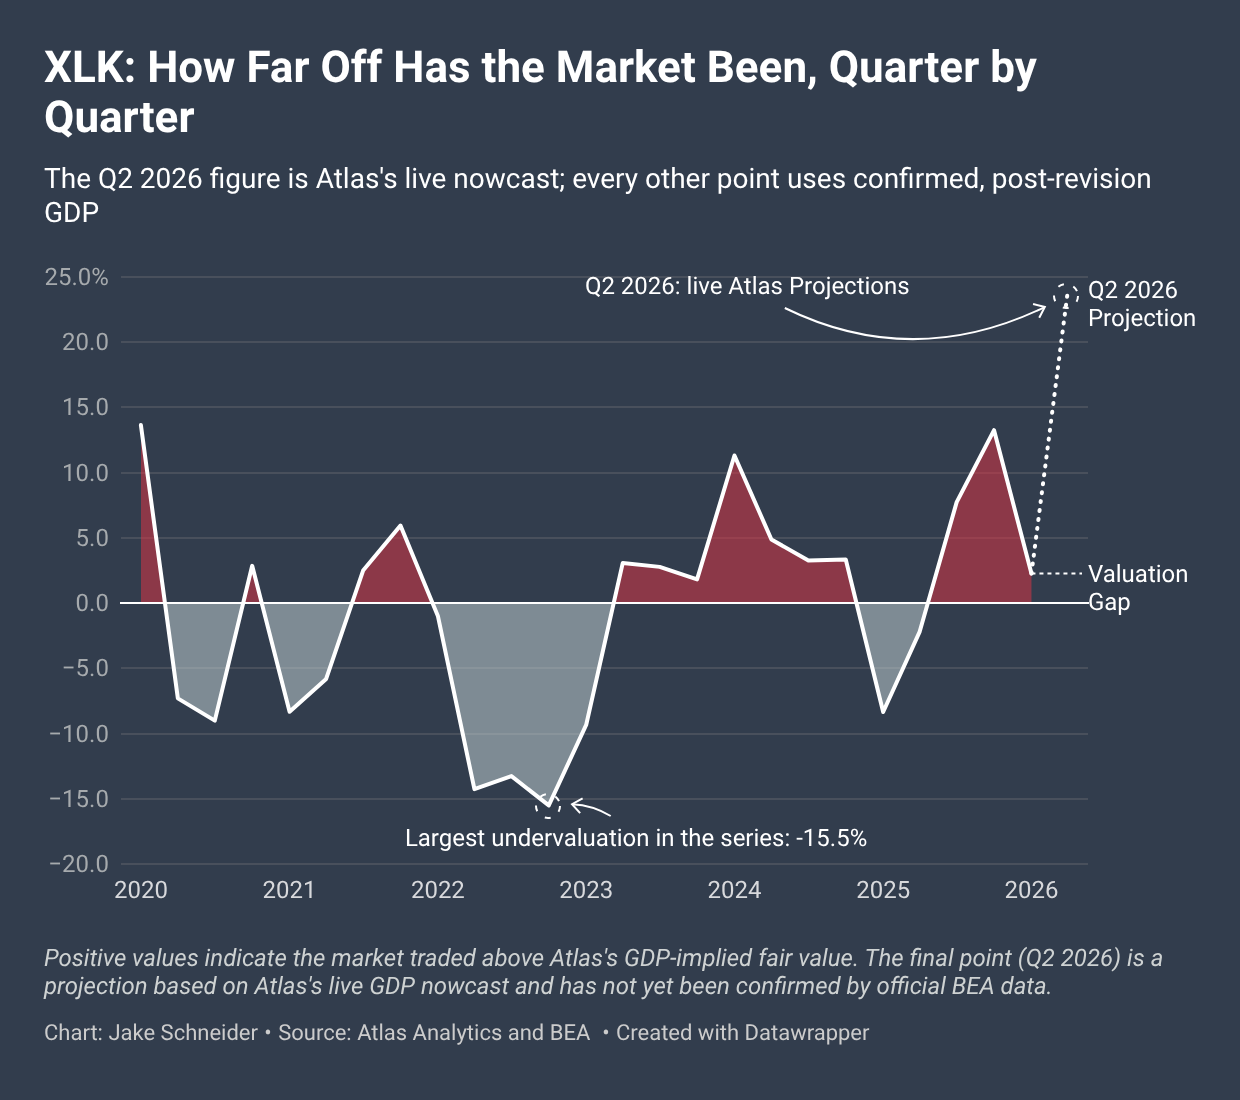
The chart shows that the relationship between market prices and GDP-implied fair values is far from constant. Through much of 2022 and early 2023, XLK traded below its GDP-implied fair value as markets adjusted to higher interest rates, slowing growth expectations, and a broad repricing of technology stocks. As macroeconomic conditions evolved, the gap gradually narrowed. By early 2024, market prices had moved above the level implied by realised economic activity and have, with few interruptions, remained there since.
This evolution is perhaps more informative than the latest observation itself. The valuation gap does not move in one direction. Periods of undervaluation are followed by periods of overvaluation, with prices repeatedly moving around their GDP-implied fair values as economic and financial conditions change. The current quarter is therefore better viewed as one point in a longer sequence than as an isolated result.
We repeated the same exercise for the remaining ETFs in our sample. While the timing and magnitude of the valuation gaps differ across sectors, the exercise reveals a similar feature across the broader market. The relationship between prices and underlying economic activity evolves over time, making it possible to distinguish temporary departures from more persistent divergences.
Two ETFs deserve equal attention for the opposite reason.
Health care (XLV) and small-cap equities (IWM) remain much closer to their GDP-implied values. Both alternate between modest overvaluation and modest undervaluation rather than drifting consistently in one direction.
That distinction matters.
If elevated valuations reflected only enthusiasm surrounding the largest technology companies, broad market benchmarks would not display the same pattern. Nor would the divergence persist across sectors with very different exposures to technological change.
Instead, the evidence suggests that optimism has become considerably more widespread.
Why GDP?
The framework rests on a simple proposition.
Corporate earnings do not grow independently from the economy forever. Household consumption, business investment, government expenditure and exports ultimately determine the revenues firms can generate. GDP is the broadest measure of that aggregate activity.
Importantly, no single macroeconomic variable explains equity prices completely, not even GDP. Interest rates matter. Credit conditions matter. Financial conditions matter. These variables influence valuation around a common anchor: the economy’s capacity to generate income.
That is why GDP sits at the center of our framework.
For the historical analysis presented above, we use final GDP after all official revisions. The exercise therefore evaluates the pricing relationship itself rather than the quality of any forecast.
Current-quarter estimates present a different challenge. Official GDP is released quarterly and revised twice afterwards. Markets therefore spend much of their time trading without knowing actual current economic conditions.
To address that gap, we combine the same valuation framework with Atlas’s live GDP nowcast, generated from proprietary satellite-based measures of economic activity.
The objective is straightforward:
Estimate today’s economy using today’s information rather than waiting for tomorrow’s official data.
What This Suggests
There are at least two plausible interpretations of these findings:
The Market Is Correct: The first is that markets are correctly looking beyond today’s economy. Expectations of stronger productivity growth, broader technological diffusion and higher future earnings may justify valuations that appear elevated relative to current GDP. Under this interpretation, prices are discounting future fundamentals rather than departing from them.
The Return of “Irrational Exuberance”: Markets may simply have moved ahead of themselves. Expectations have risen faster than realised economic activity, leaving valuations increasingly detached from the economy that ultimately supports corporate earnings.
Our analysis does not distinguish between these explanations.
It establishes something narrower, but also more measurable.
Key Takeaway
The gap between equity prices and current economic activity has become persistent, broad-based and larger over time. Technology remains the most expensive corner of the market, but it no longer appears exceptional. The same pattern is now visible across much of the market.
We do not know whether today’s valuations will ultimately prove justified. We do know that markets are pricing an economy considerably stronger than the one reflected in current GDP. Whether that gap reflects foresight or irrational exuberance is a question only time can answer.
Want to know our Atlas ETF estimates in-real time? Contact us to subscribe to an enterprise license and get the power of satellite-derived economic and equity estimates delivered through our proprietary portal to your inbox every week.