


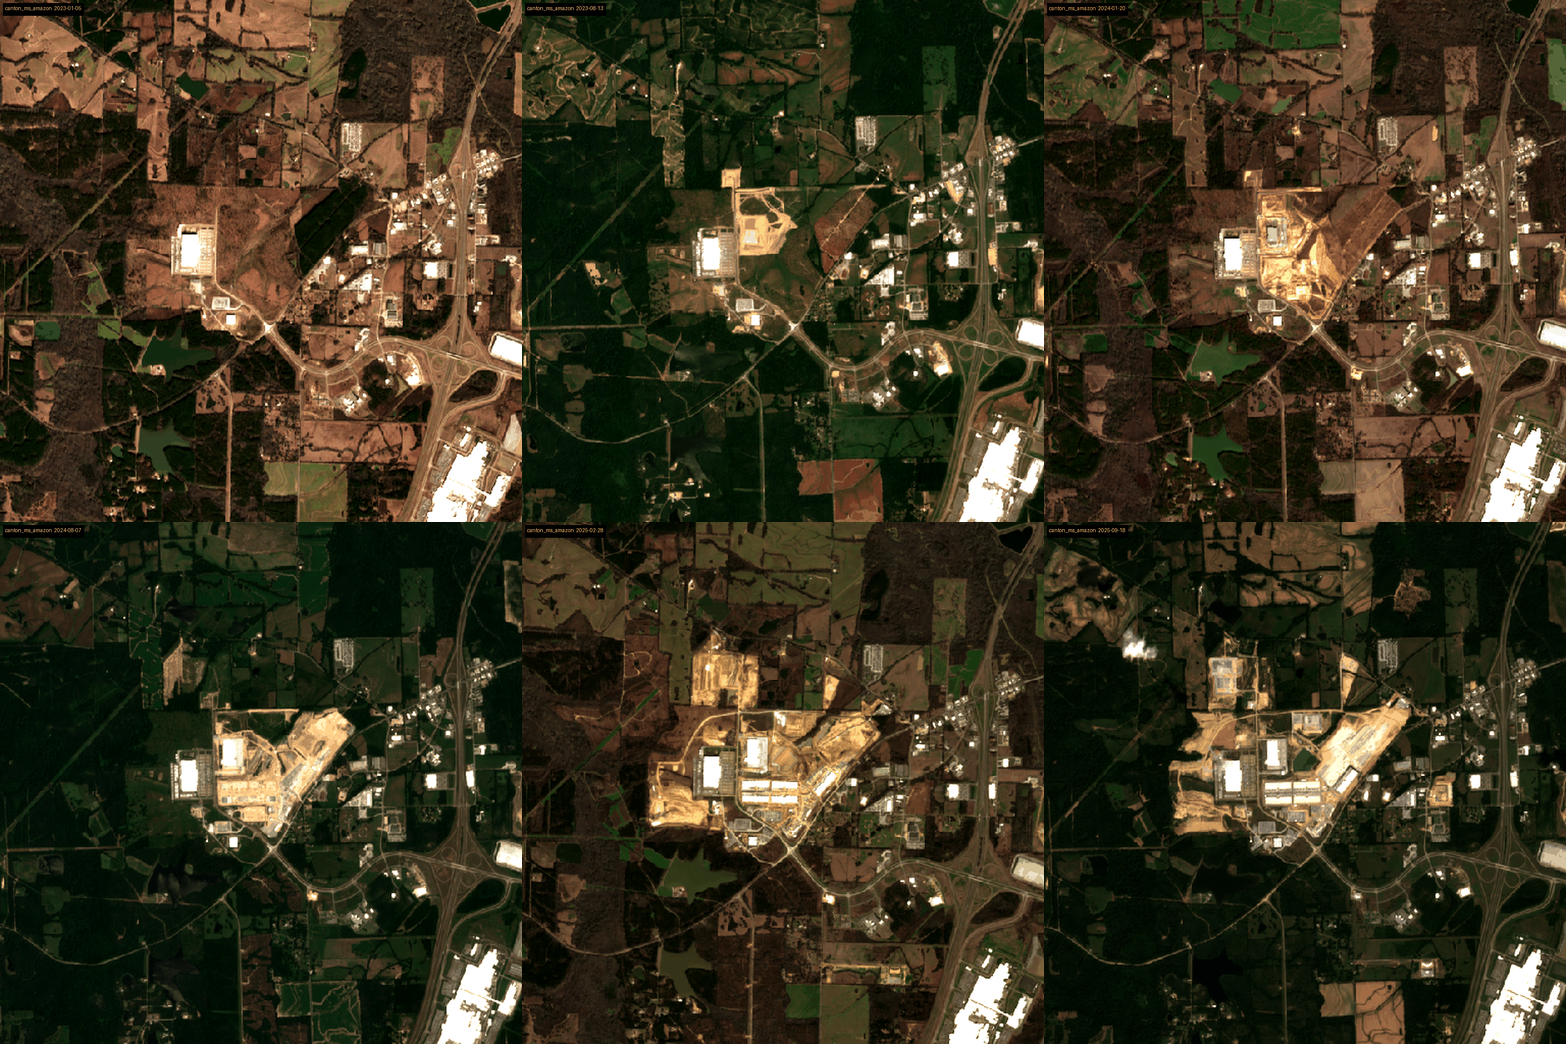
Amazon announces a hyperscale data center. Regulators approve permits. Investors update forecasts. Utilities begin planning transmission upgrades.
But one question remains unanswered:
Is the construction actually happening?
How is the project actually developing once construction begins?
For much of the past century, this distinction mattered relatively little. Many infrastructure projects were local in both their benefits and their costs. Increasingly, however, large infrastructure investments interact with networks that extend well beyond the project site. Electricity, water, transport, and communications systems connect places that administrative boundaries separate. As a result, the economic consequences of infrastructure investments are not always experienced where the investment itself is located.
Data centers provide a useful illustration.
A proposed hyperscale data center in Alabama, for example, was projected to consume nearly two million gallons of water each day, approximately two-thirds of the daily water use of its host city1.
Electricity presents a similar challenge.
Under the traditional utility model, investments required to accommodate large new electricity demand are generally recovered through regulated rate structures. Whether existing approaches to cost allocation remain appropriate for exceptionally large electricity consumers, such as hyperscale data centers, has become an increasingly important regulatory question2.
The immediate economic benefits of a data center, including investment, employment, and local tax revenue, are concentrated where the facility is located. Some of the associated infrastructure costs, however, may extend across a much broader utility system.
The challenge is therefore not simply to understand these consequences after they occur. It is to observe infrastructure development while it is taking place.
This is where geospatial observation complements administrative information. A recent study by the Federation of American Scientists demonstrates how commercially available satellite imagery can independently track the physical construction of hyperscale data centers.
Comparing observable construction activity with publicly announced development timelines, the study shows that announcements and physical development do not always progress in parallel3.
The contribution of satellite imagery is not that it replaces administrative records or company disclosures. Instead, it provides an independent observation of physical development that can be compared with existing sources to verify how infrastructure projects evolve over time.
This distinction matters because many of the consequences of infrastructure investment emerge gradually. Electricity demand rises as facilities become operational. Supporting infrastructure expands as construction progresses. Administrative datasets, utility filings, and economic statistics eventually capture these developments, but often only after investment decisions have been made.
Geospatial observation cannot answer these questions on its own. Used alongside administrative records and economic analysis, however, it can reduce the interval between physical development and empirical observation.
Infrastructure Operates Through Networks
The reason is straightforward.
The economic effects of infrastructure are often assumed to be local because the infrastructure itself occupies a specific location. In practice, however, many infrastructure investments operate through interconnected systems whose boundaries differ from administrative jurisdictions.
Electricity is generated in one place, transmitted across regional networks, and priced through regulated utility systems. Water resources are shared across river basins and aquifers. Transport infrastructure influences economic activity well beyond the communities in which it is constructed.
Consequently, the geography of infrastructure investment does not necessarily coincide with the geography of its economic consequences.
Electricity illustrates this particularly well. Large data centers require substantial investments in generation, transmission, and distribution infrastructure before they become operational. Under traditional utility regulation, these investments are generally recovered through regulated rate structures that allocate costs across customers within a utility system. Whether existing regulatory frameworks remain appropriate for exceptionally large electricity consumers has therefore become an increasingly important policy question as electricity demand from hyperscale data centers continues to grow4.
The central issue is not that costs are necessarily shifted to other consumers, but that the economic consequences of new infrastructure depend on the structure of the utility network rather than the location of the facility alone.
Recent work by Lange, Bagwe, Murlidharan, and Rojas examines this question by mapping data-center development onto utility service territories rather than administrative boundaries. The study finds evidence consistent with residential electricity prices increasing in non-host counties connected through shared utility systems, while industrial electricity prices respond more strongly in host counties.
The authors emphasize that these estimates should be interpreted as evidence on electricity price incidence rather than as a full welfare analysis because the study does not directly observe utility rate cases, tariff provisions, or cost-allocation decisions. Their findings suggest that the geography of electricity price incidence may differ from the geography of infrastructure investment, reinforcing the importance of understanding the networks through which infrastructure operates.
The same principle extends beyond electricity prices. Muller estimates that the environmental damages associated with electricity consumption by U.S. data centers are geographically concentrated, shaped less by where a given facility is sited than by the emissions profile of the regional grid supplying it5. Although the outcomes are different, both studies point to the same conclusion. The consequences of major infrastructure projects frequently propagate through interconnected systems rather than remaining confined to the locations where projects are built.
This is precisely where geospatial intelligence becomes valuable. Satellite imagery identifies where physical infrastructure is emerging, while economic analysis explains how its consequences propagate through connected systems. Neither is sufficient on its own. Together, they provide policymakers with a more complete understanding of infrastructure development than either source could offer independently.
From Observation to Decision
The examples discussed above point to a broader lesson.
Modern infrastructure projects generate information long before their full economic consequences appear in conventional statistics.
Administrative records document what has been approved. Satellite imagery observes what is physically happening on the ground. Economic analysis explains how those developments interact with electricity systems, supply chains, labor markets, or environmental outcomes. Each source answers a different question.
Viewed independently, each source also has clear limitations. Administrative records cannot verify whether announced projects are progressing as expected. Satellite imagery can observe physical development but cannot explain its economic significance. Economic indicators ultimately capture many of the consequences of infrastructure investment, but often only after substantial time has passed. Combining these sources provides a more complete picture than any one of them can offer individually.
This integrated approach becomes increasingly valuable as infrastructure projects grow larger and more interconnected. Whether the question concerns electricity systems, transport corridors, industrial facilities, logistics networks, or urban development, policymakers are increasingly required to make decisions before conventional datasets fully reflect changing economic conditions. Independent geospatial observation, interpreted alongside administrative information and economic analysis, can help reduce that information gap.
The value of geospatial intelligence therefore lies not simply in producing better images, but in improving economic understanding. Satellite imagery allows infrastructure to be observed as it develops. Economic analysis helps explain why those developments matter. Together, they provide policymakers with earlier, more comprehensive evidence for evaluating infrastructure investment and its broader consequences.
From Research to Practice
The questions discussed throughout this article are no longer purely academic.
At Atlas Analytics, we are in the early innings of applying geospatial intelligence to real-world infrastructure decisions alongside leading institutions in finance, consulting, and the public sector. Our work combines satellite imagery, administrative records, and economic modeling to help organizations monitor infrastructure development, understand its broader economic implications, and make better-informed decisions before conventional datasets fully reflect changing conditions.
We believe this is just the beginning. As satellite imagery becomes more frequent, computer vision continues to improve, and economic models become increasingly integrated with geospatial data, the opportunity to generate earlier, more actionable economic intelligence will continue to expand.
If your organization is evaluating major infrastructure investments, tracking industrial development, or exploring how geospatial intelligence can improve decision-making, we’d welcome the opportunity to start a conversation. We are actively partnering with a small number of organizations to develop new applications and would be delighted to explore how this approach could support your work.
Interested in collaborating? If your organization is exploring how geospatial intelligence can support infrastructure planning, economic analysis, or investment decision-making, we’d love to hear from you. Contact us at contact@atlasanalytics.com to discuss research collaborations, pilot projects, or bespoke geospatial intelligence solutions.
Lee Hedgepeth. “Water Utility Says It Can’t Meet Demand for Alabama Data Center Without ‘Significant Upgrades.’” Inside Climate News. July 12, 2025.
Ari Peskoe. How Data Centers May Lead to Higher Electricity Bills. Harvard Law Today. September 2025.
Federation of American Scientists. Tracking Hyperscale AI Data Center Growth with Satellite Imagery. 2026.
Herman Lange, Sahil Bagwe, Aditya Murlidharan, and Lothar Rojas. Shared Infrastructure, Shared Burdens? Data Centers and Electricity Price Incidence. Preliminary Draft, Harvard Kennedy School, April 2026.
Nicholas Z. Muller. Measuring the Impact of Data Centers in the United States Economy: Monetary Damage from Air Pollution and Greenhouse Gas Emissions. NBER Working Paper No. 35100, National Bureau of Economic Research, April 2026.
